GUIDES
30 step-by-step guides to setting up monitoring, with screenshots and ready-to-copy examples. Most take under five minutes.
BASICS
Your account, the dashboard and what the numbers mean.
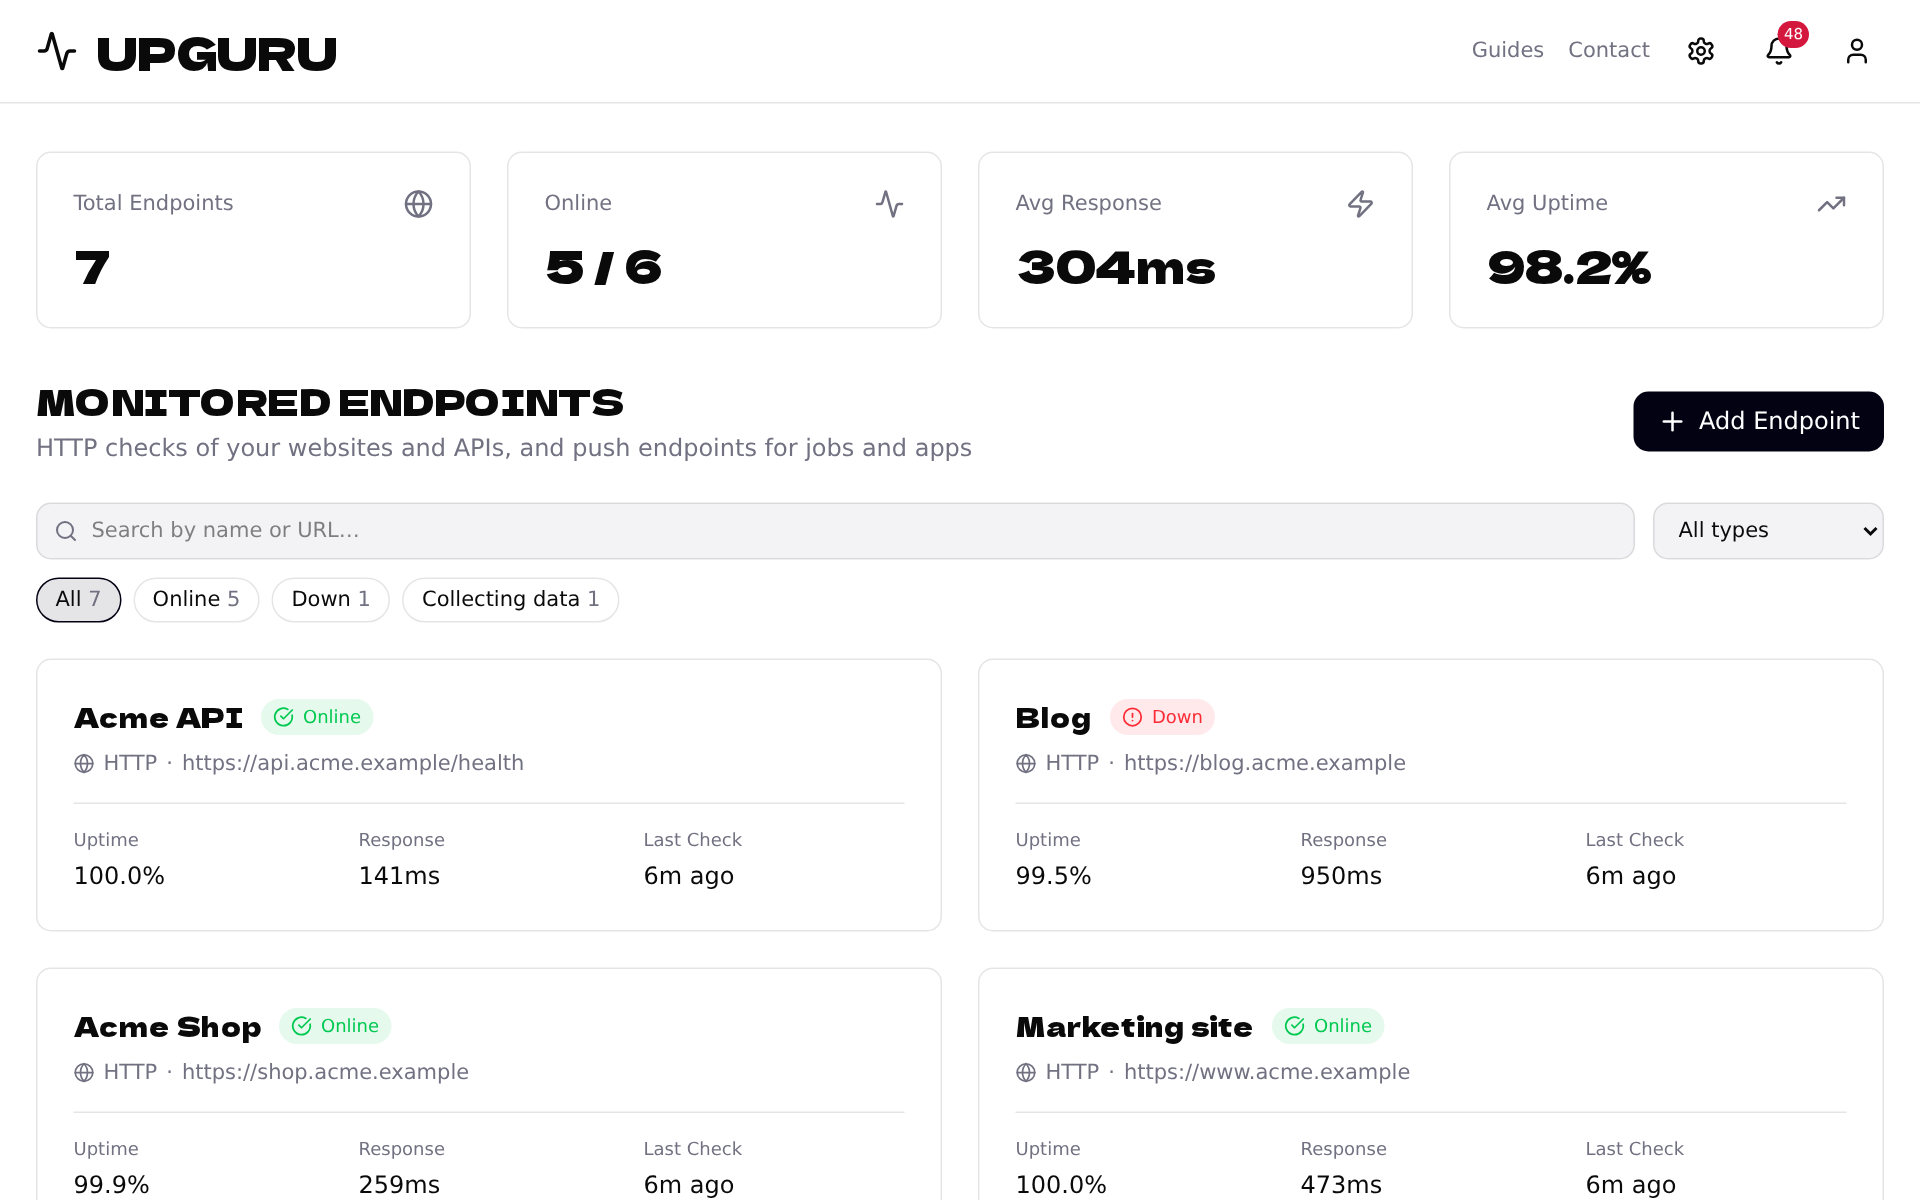
Get started with UPGURU
Create your account and find your way around the dashboard.
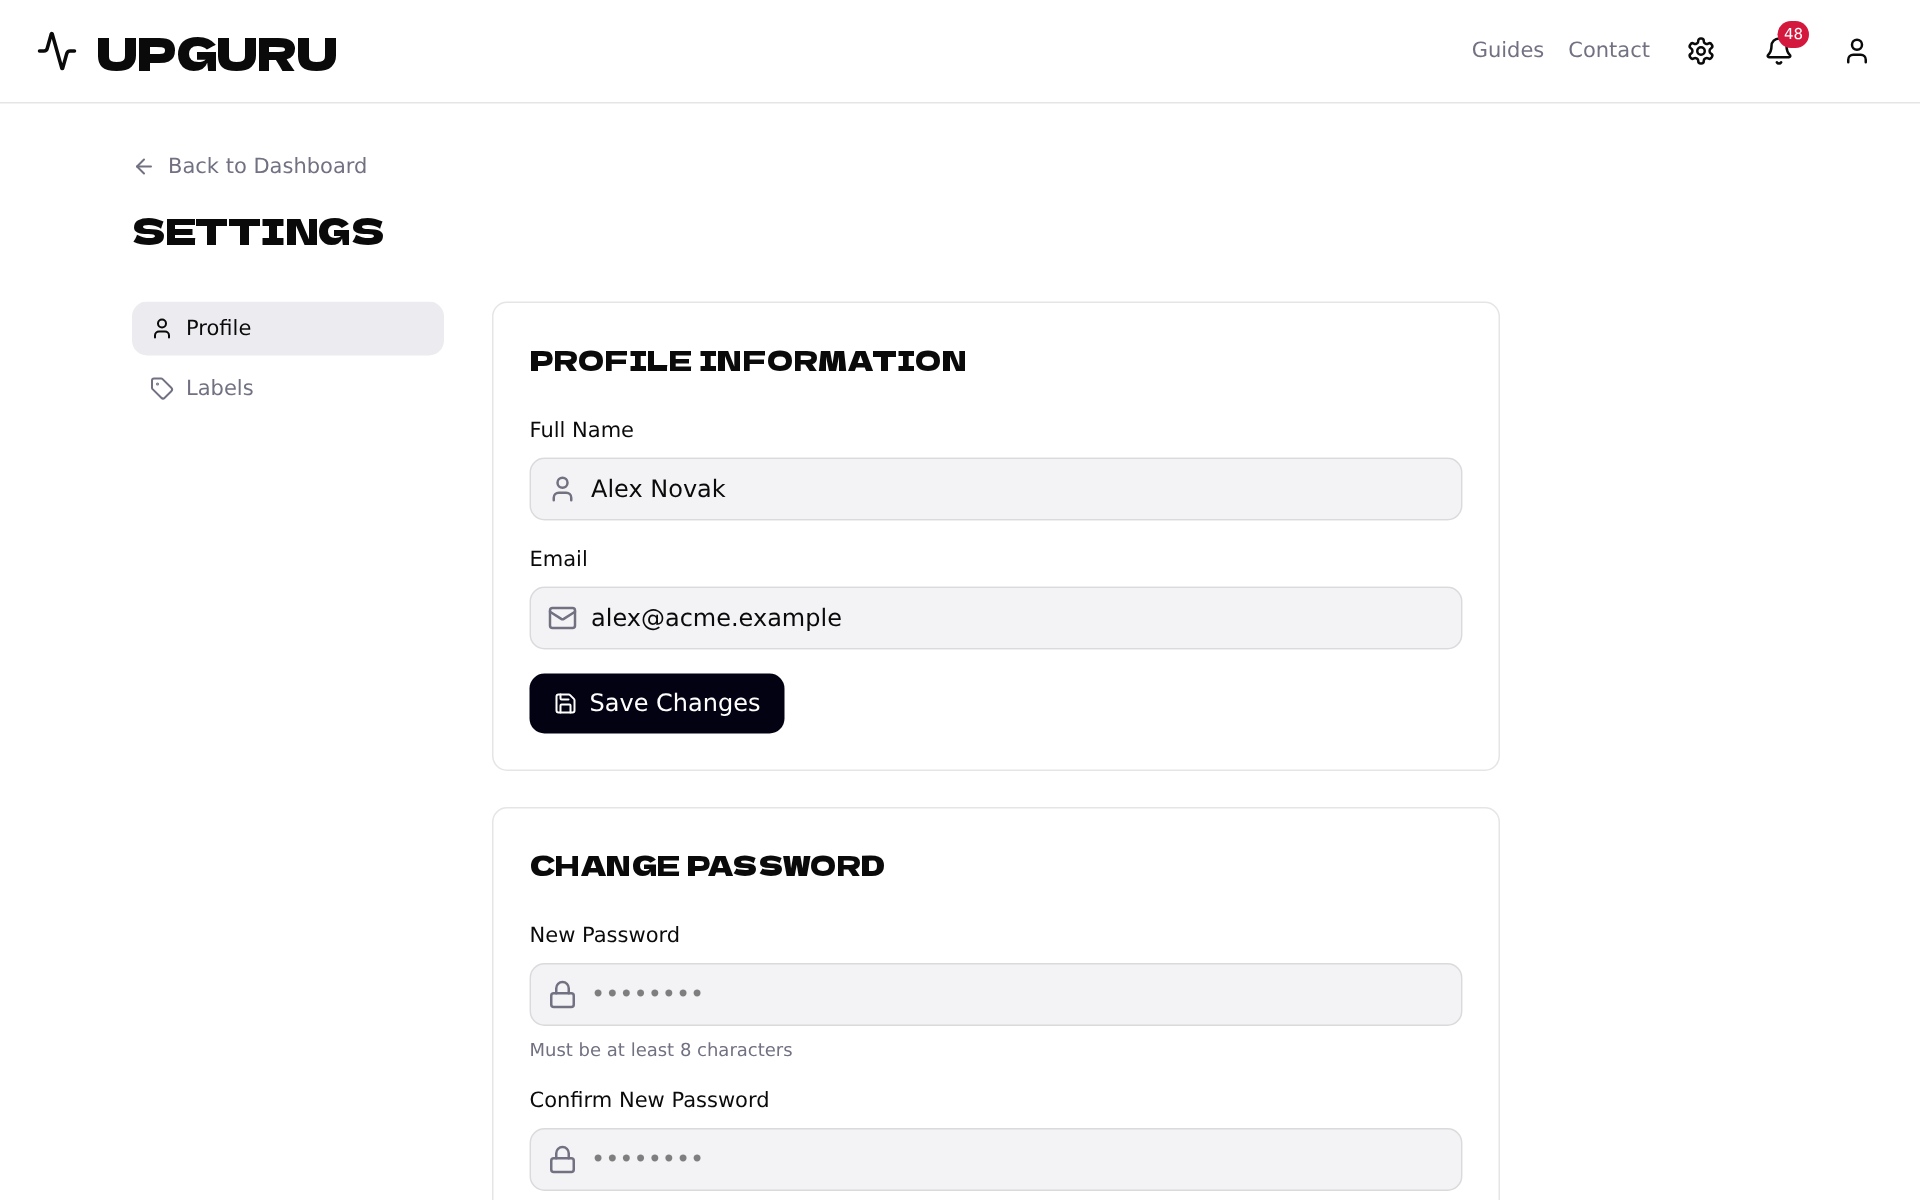
Your account
Change your name, email or password, and sign in with Google or Facebook.
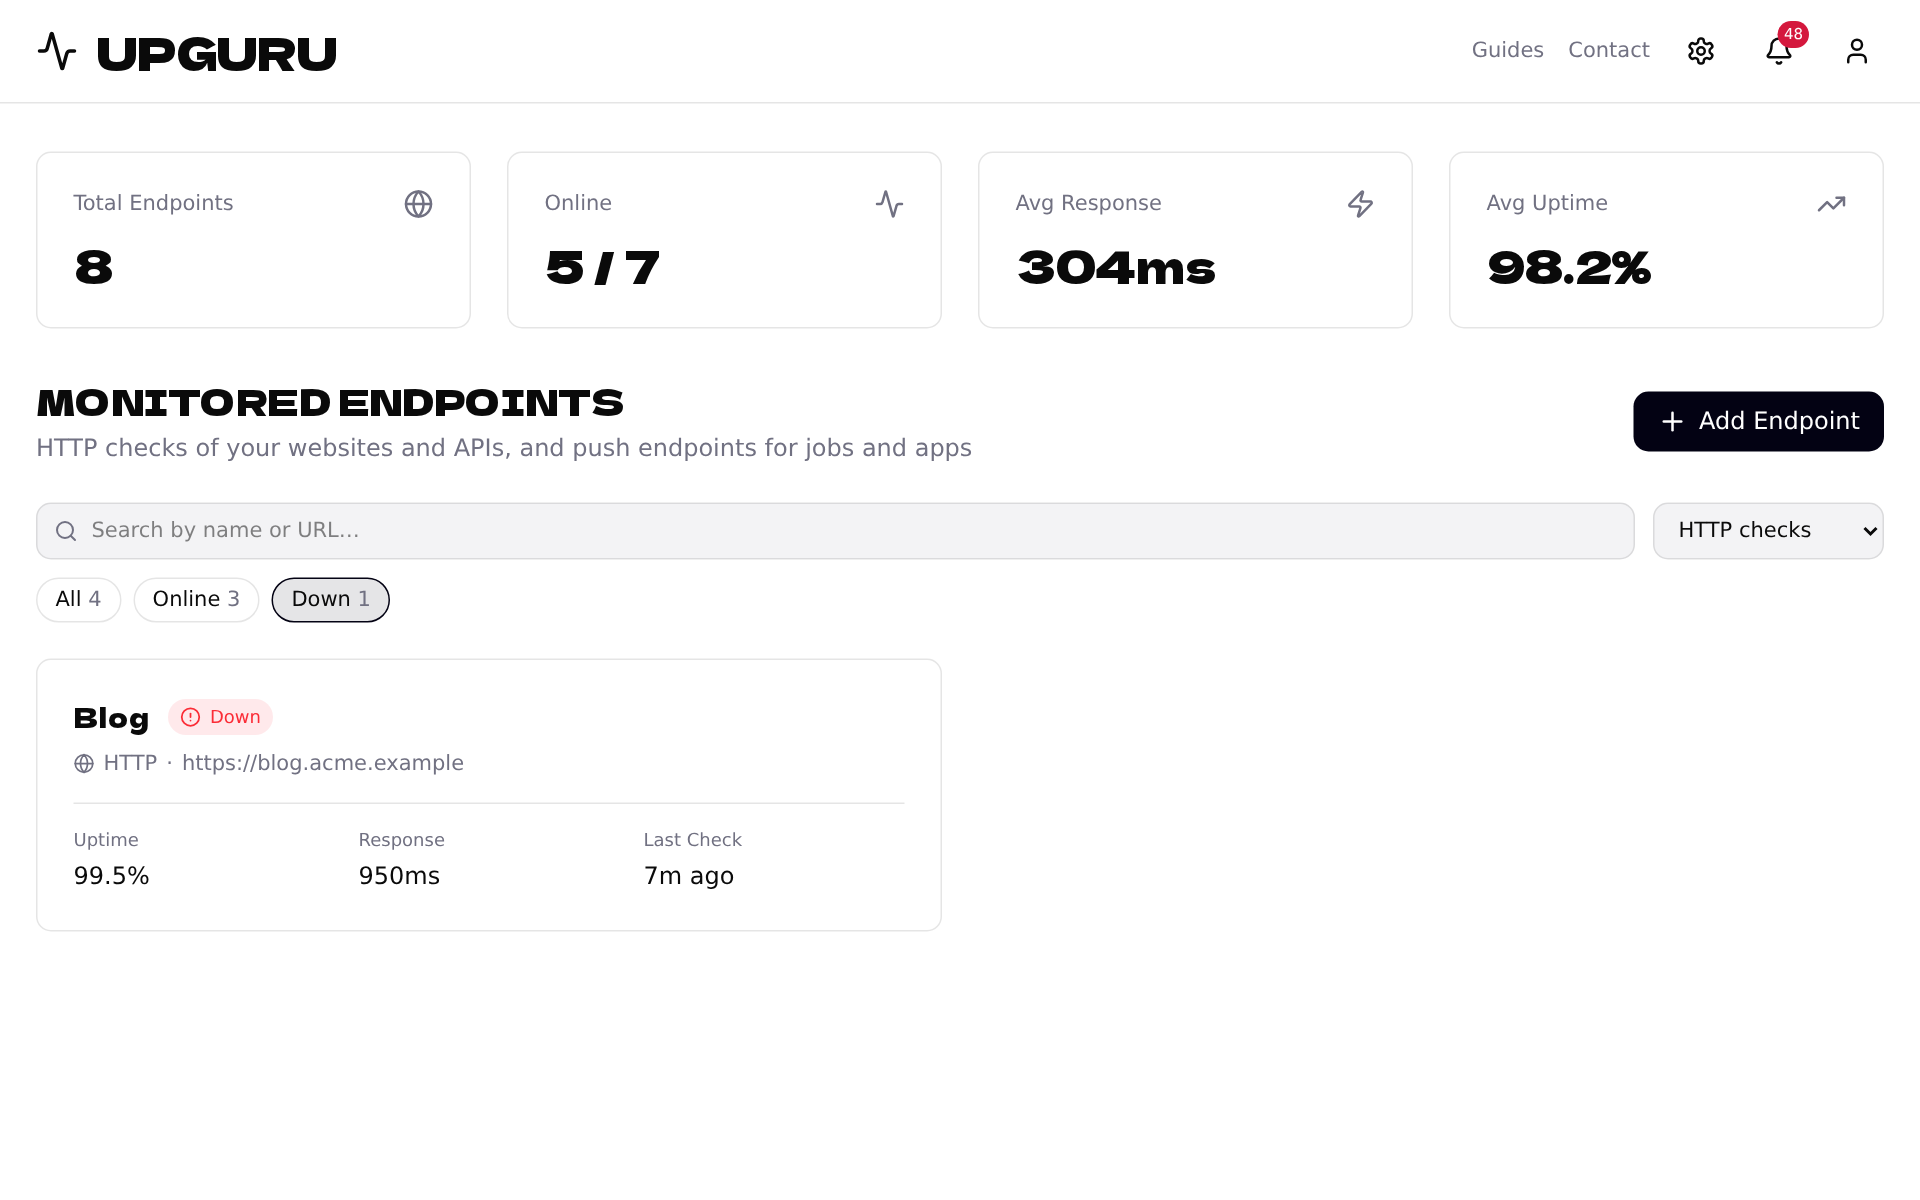
Find any endpoint fast
Search, filter by type and status, and page through a long list.
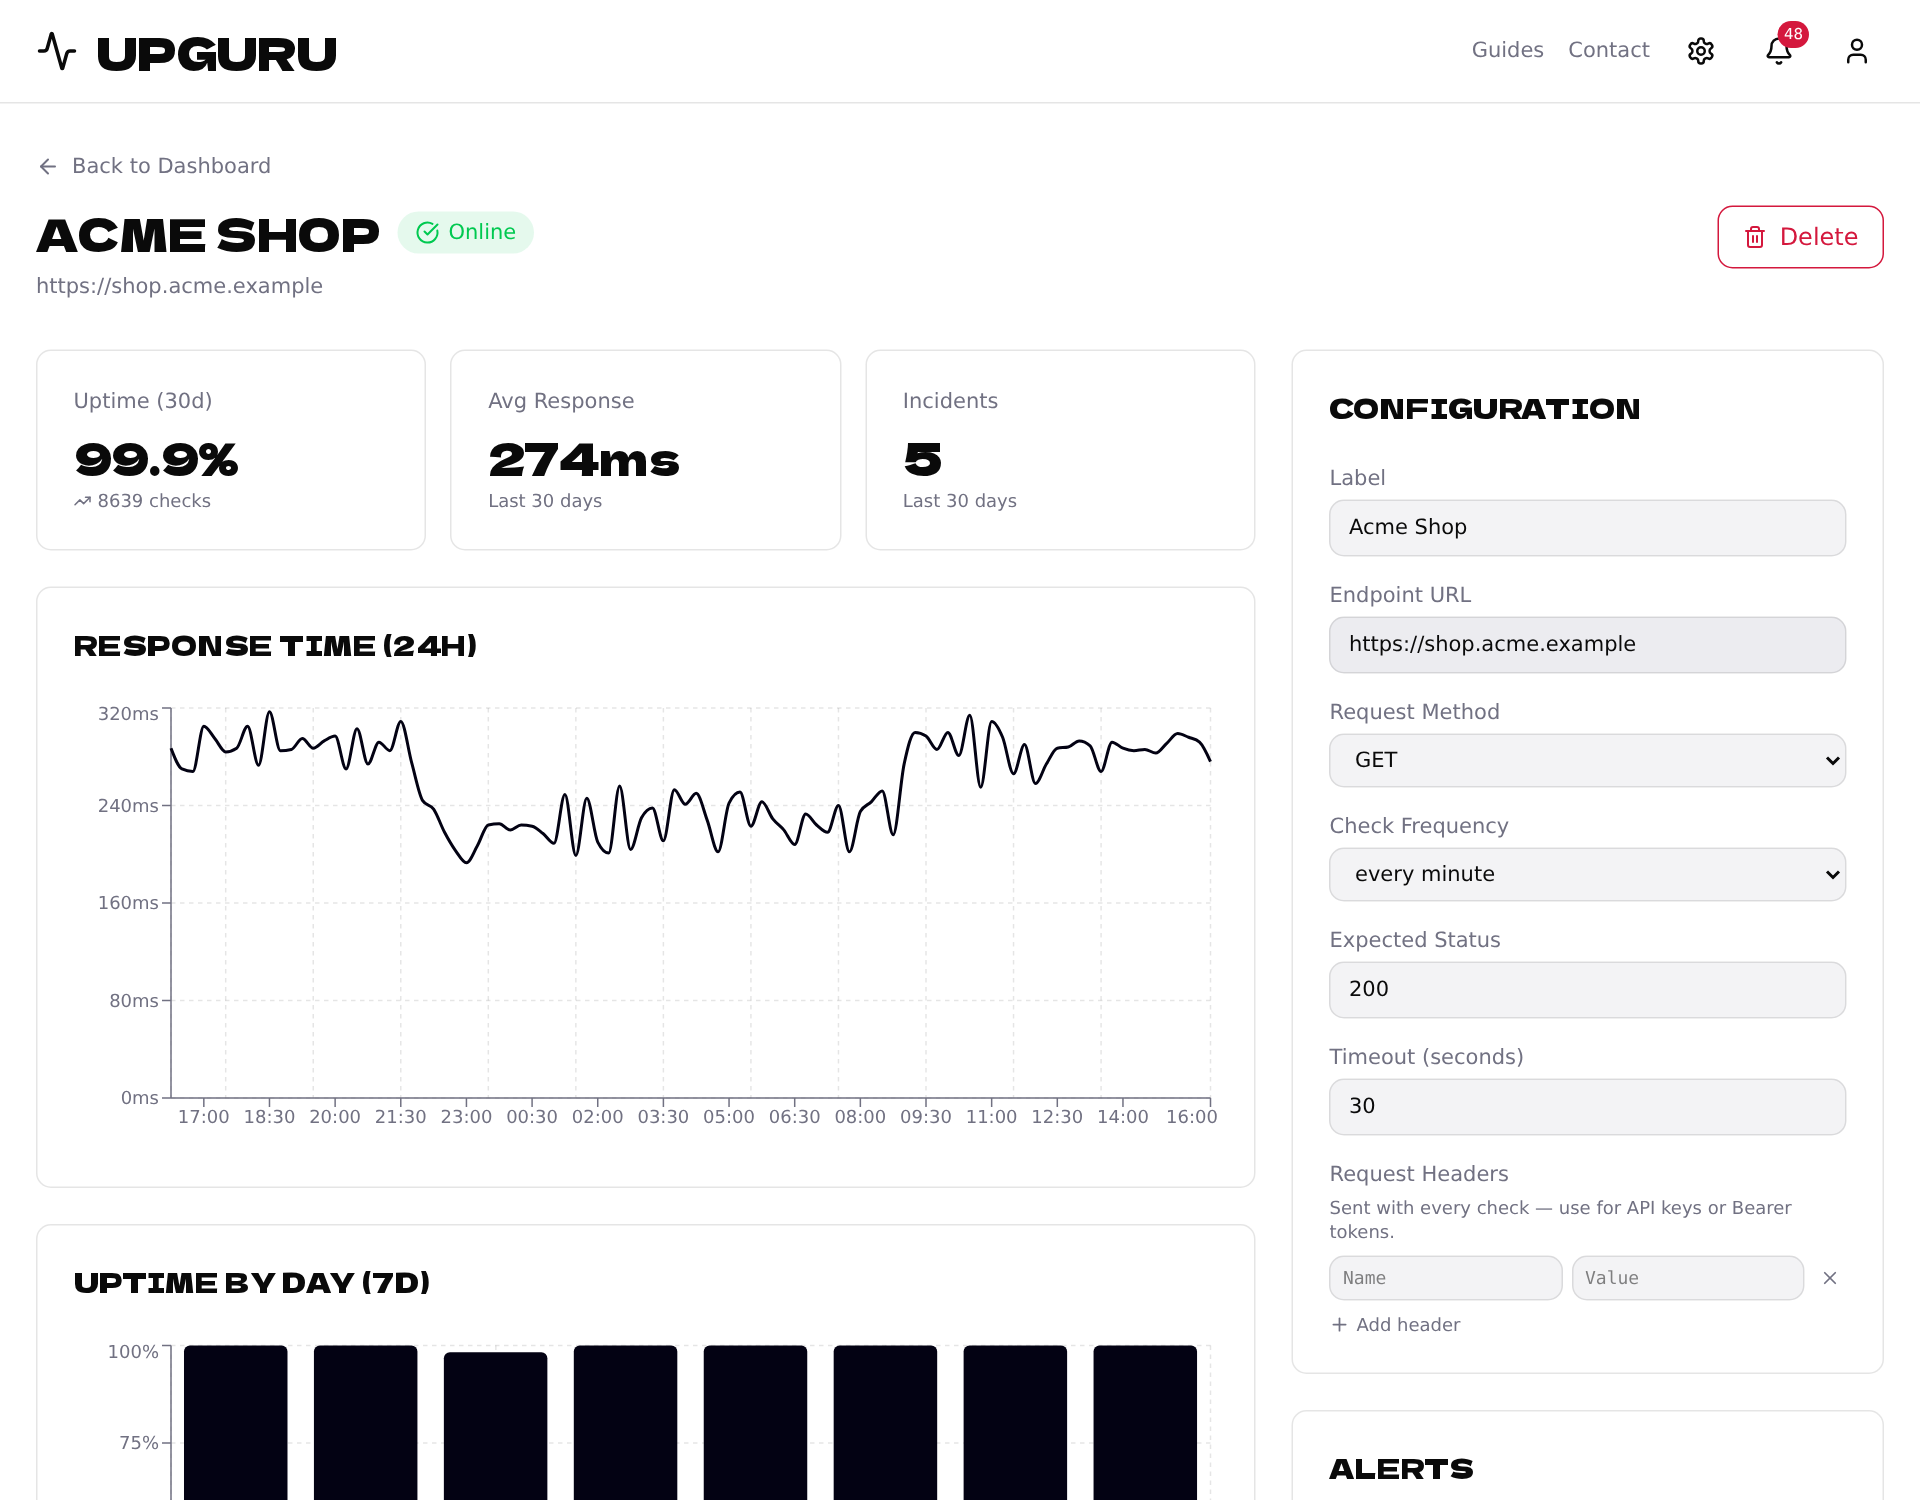
What uptime, response time and incidents mean
The numbers on your dashboard and detail pages, explained in plain words.
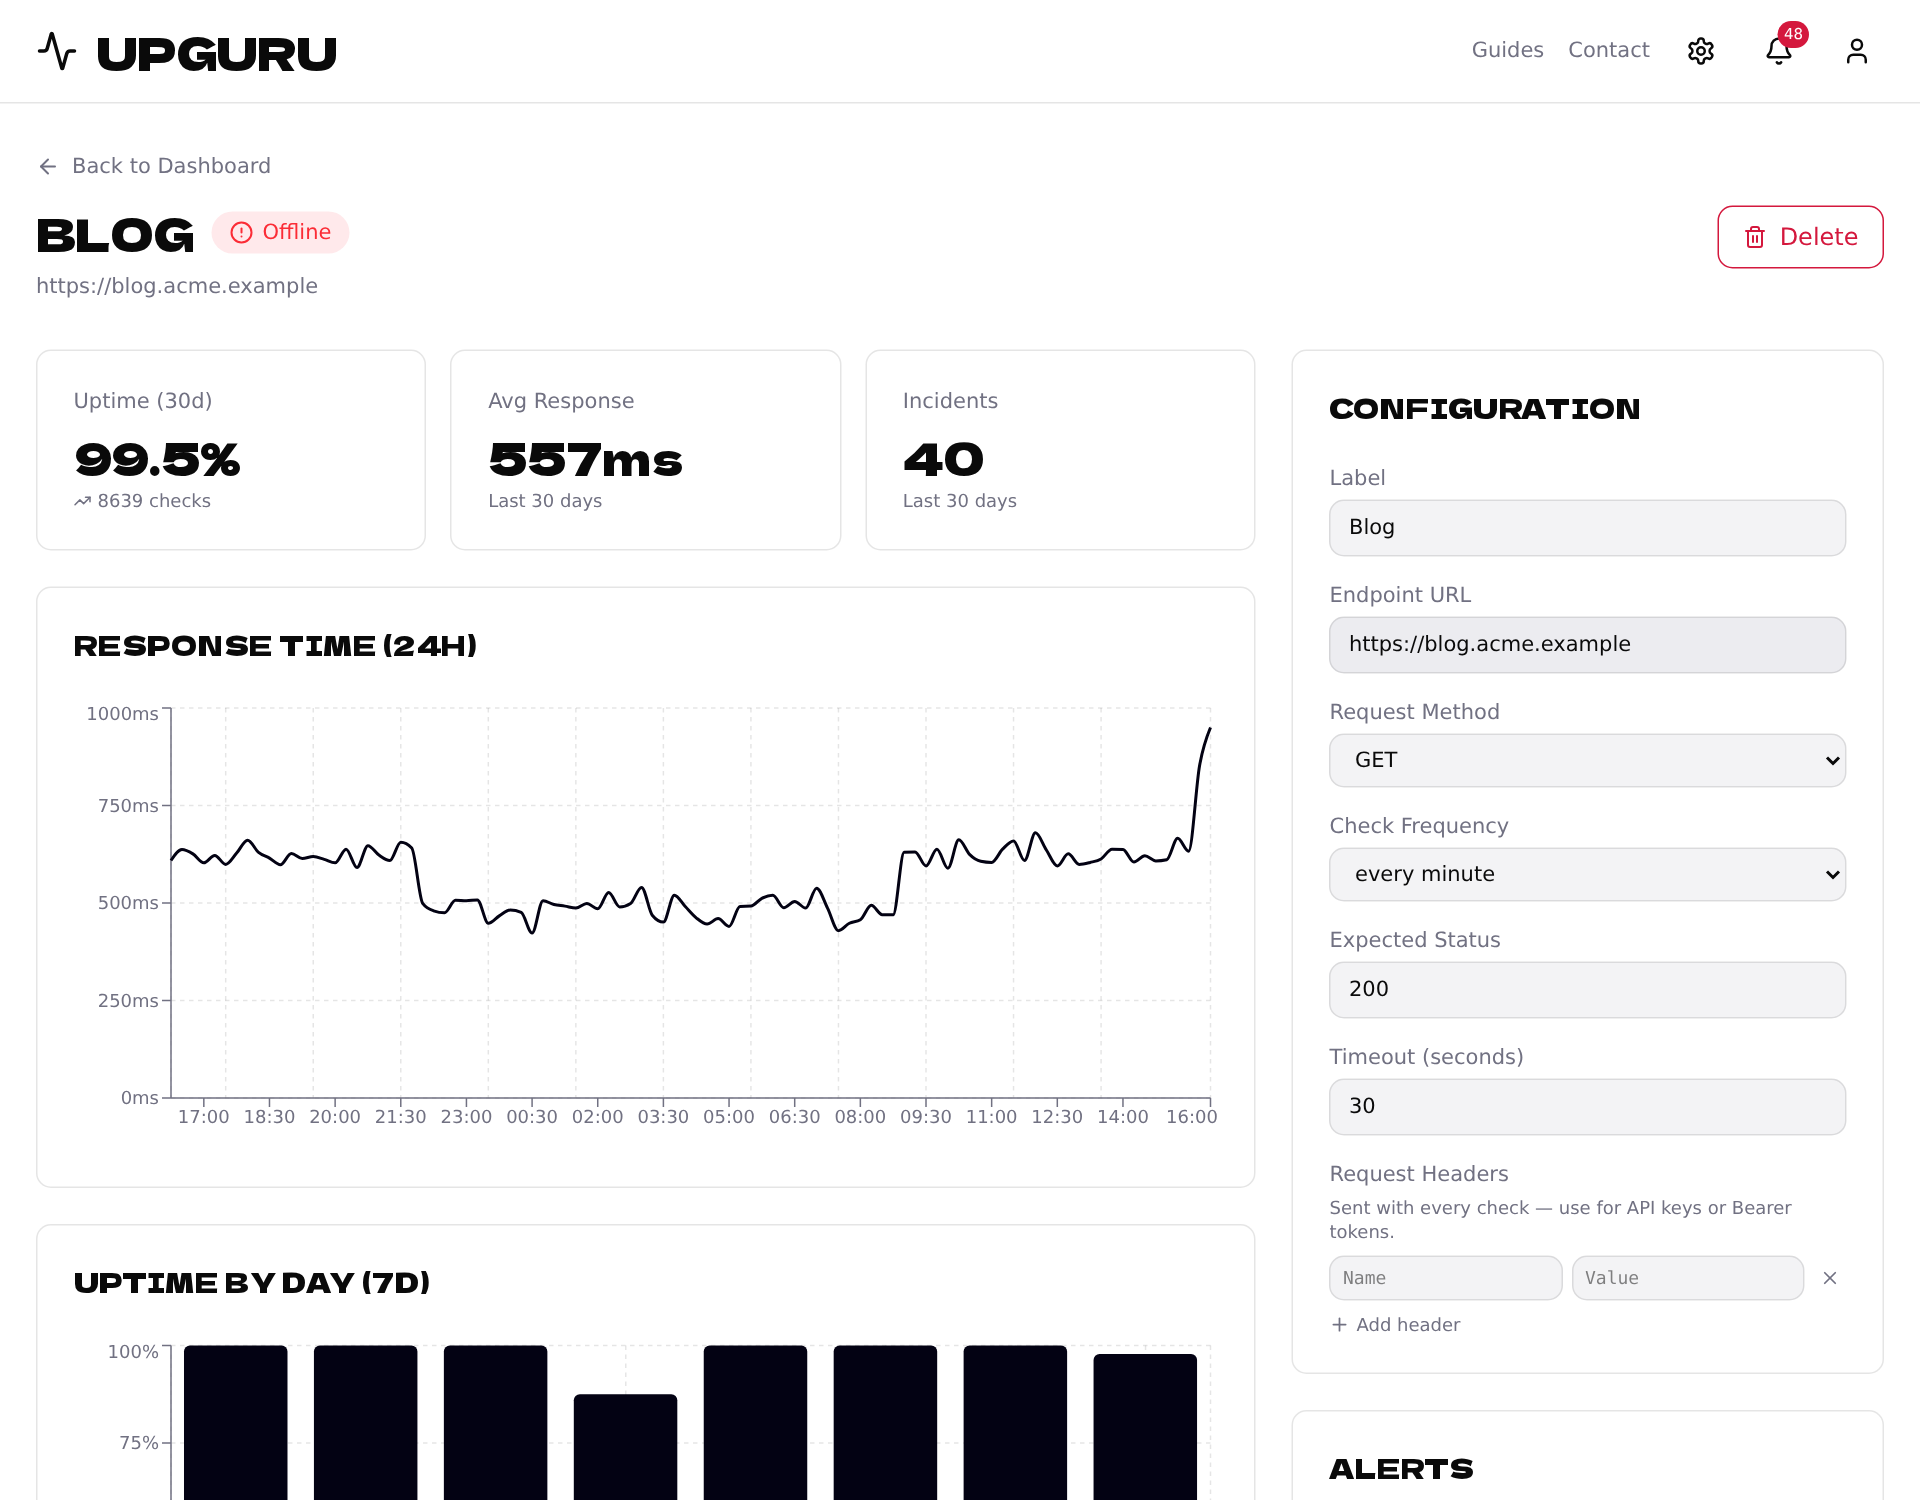
Why is my endpoint down?
The most common reasons a check fails, and how to fix each of them.
WEBSITES AND APIS
Checks we run against your sites every minute.
Monitor a website or API
Get an email the moment your site stops responding. All you need is its address.
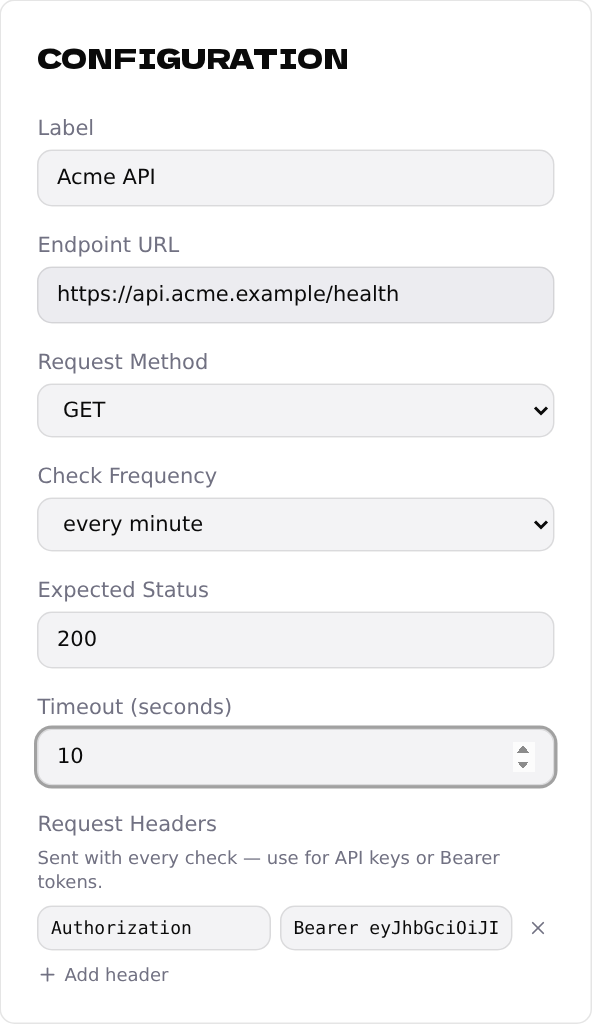
Monitor an API that needs a key
Send an API key or Bearer token with every check.
Expected status codes and timeouts
Tell UPGURU which answer counts as working and how long to wait for it.
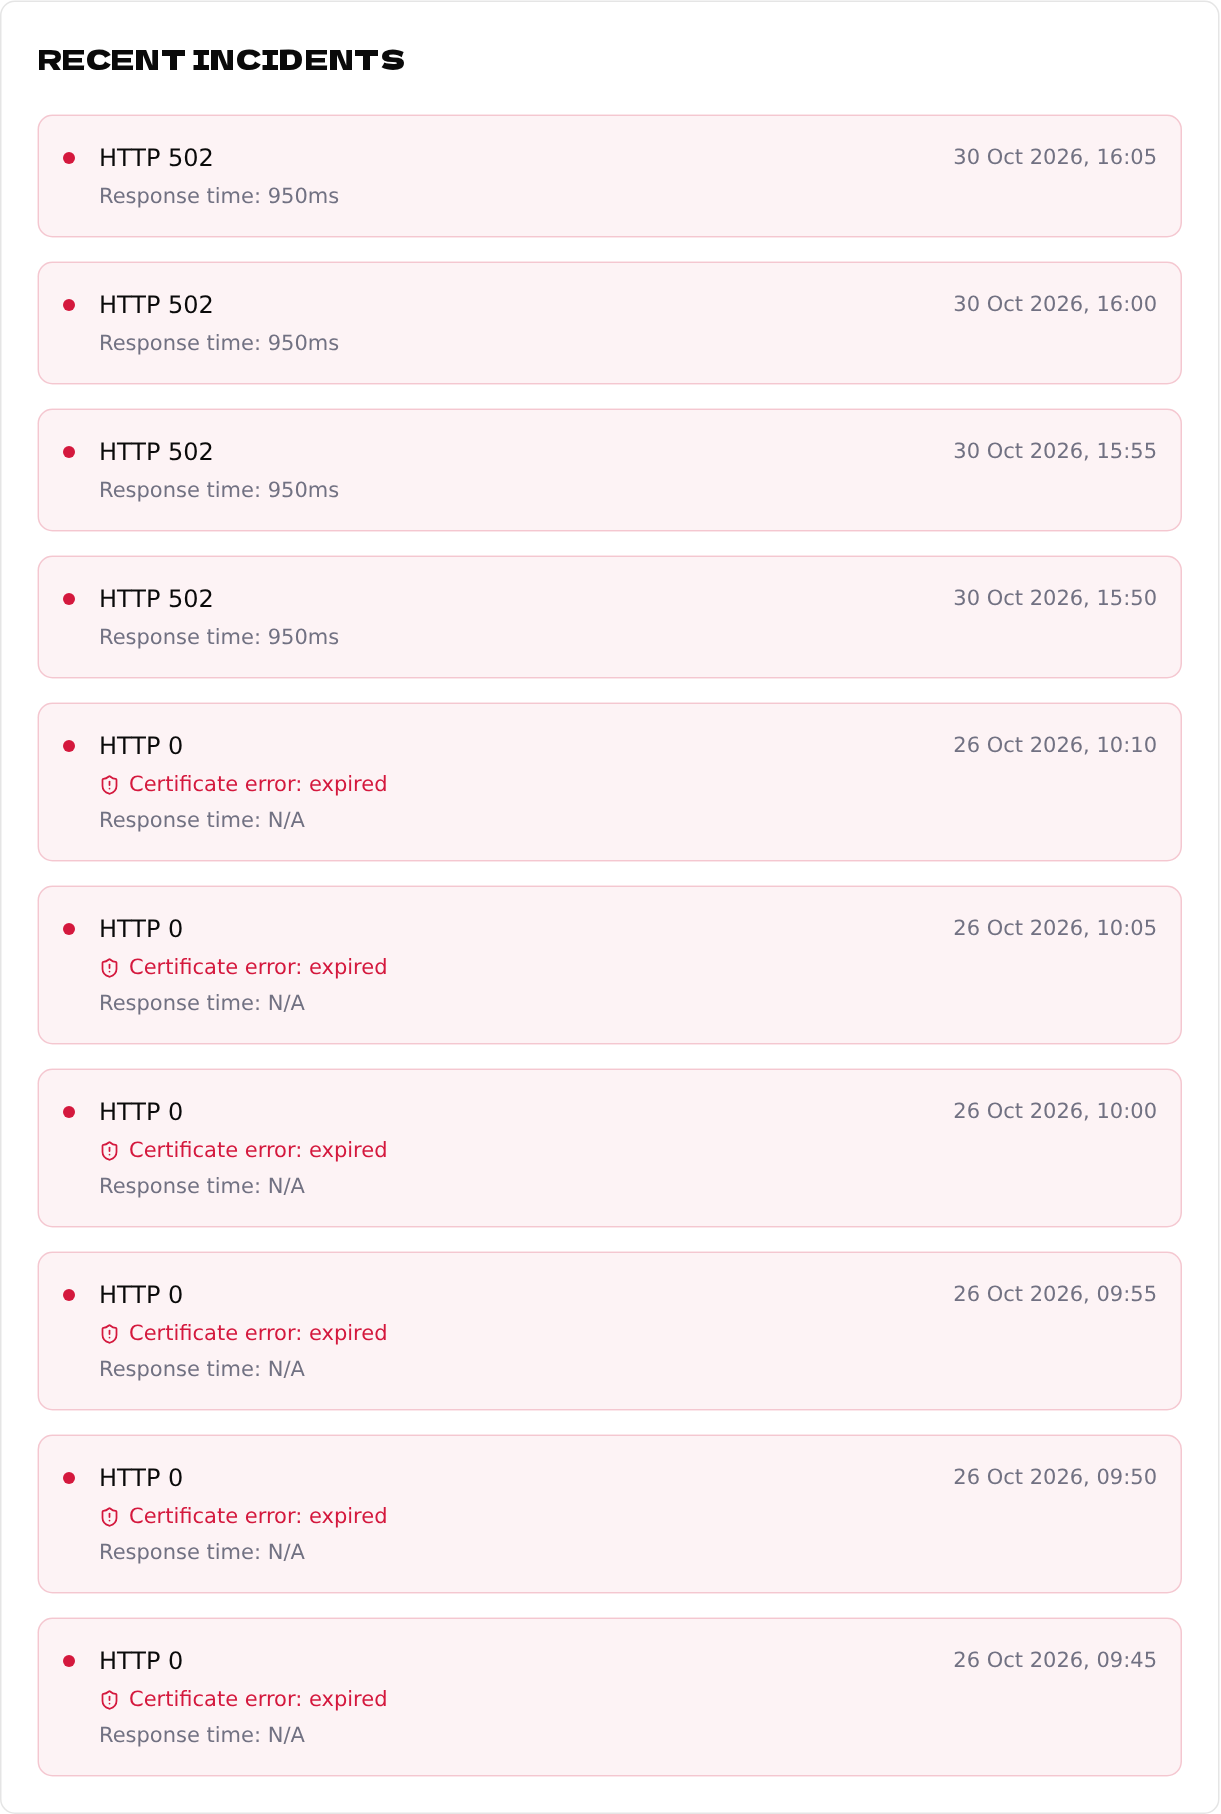
SSL certificate alerts
Find out when your site's certificate expires or stops being valid.
Choosing a check frequency
Every minute or every 15 minutes? How to pick the right interval.
CRON JOBS
Know when a scheduled job fails or stops running.
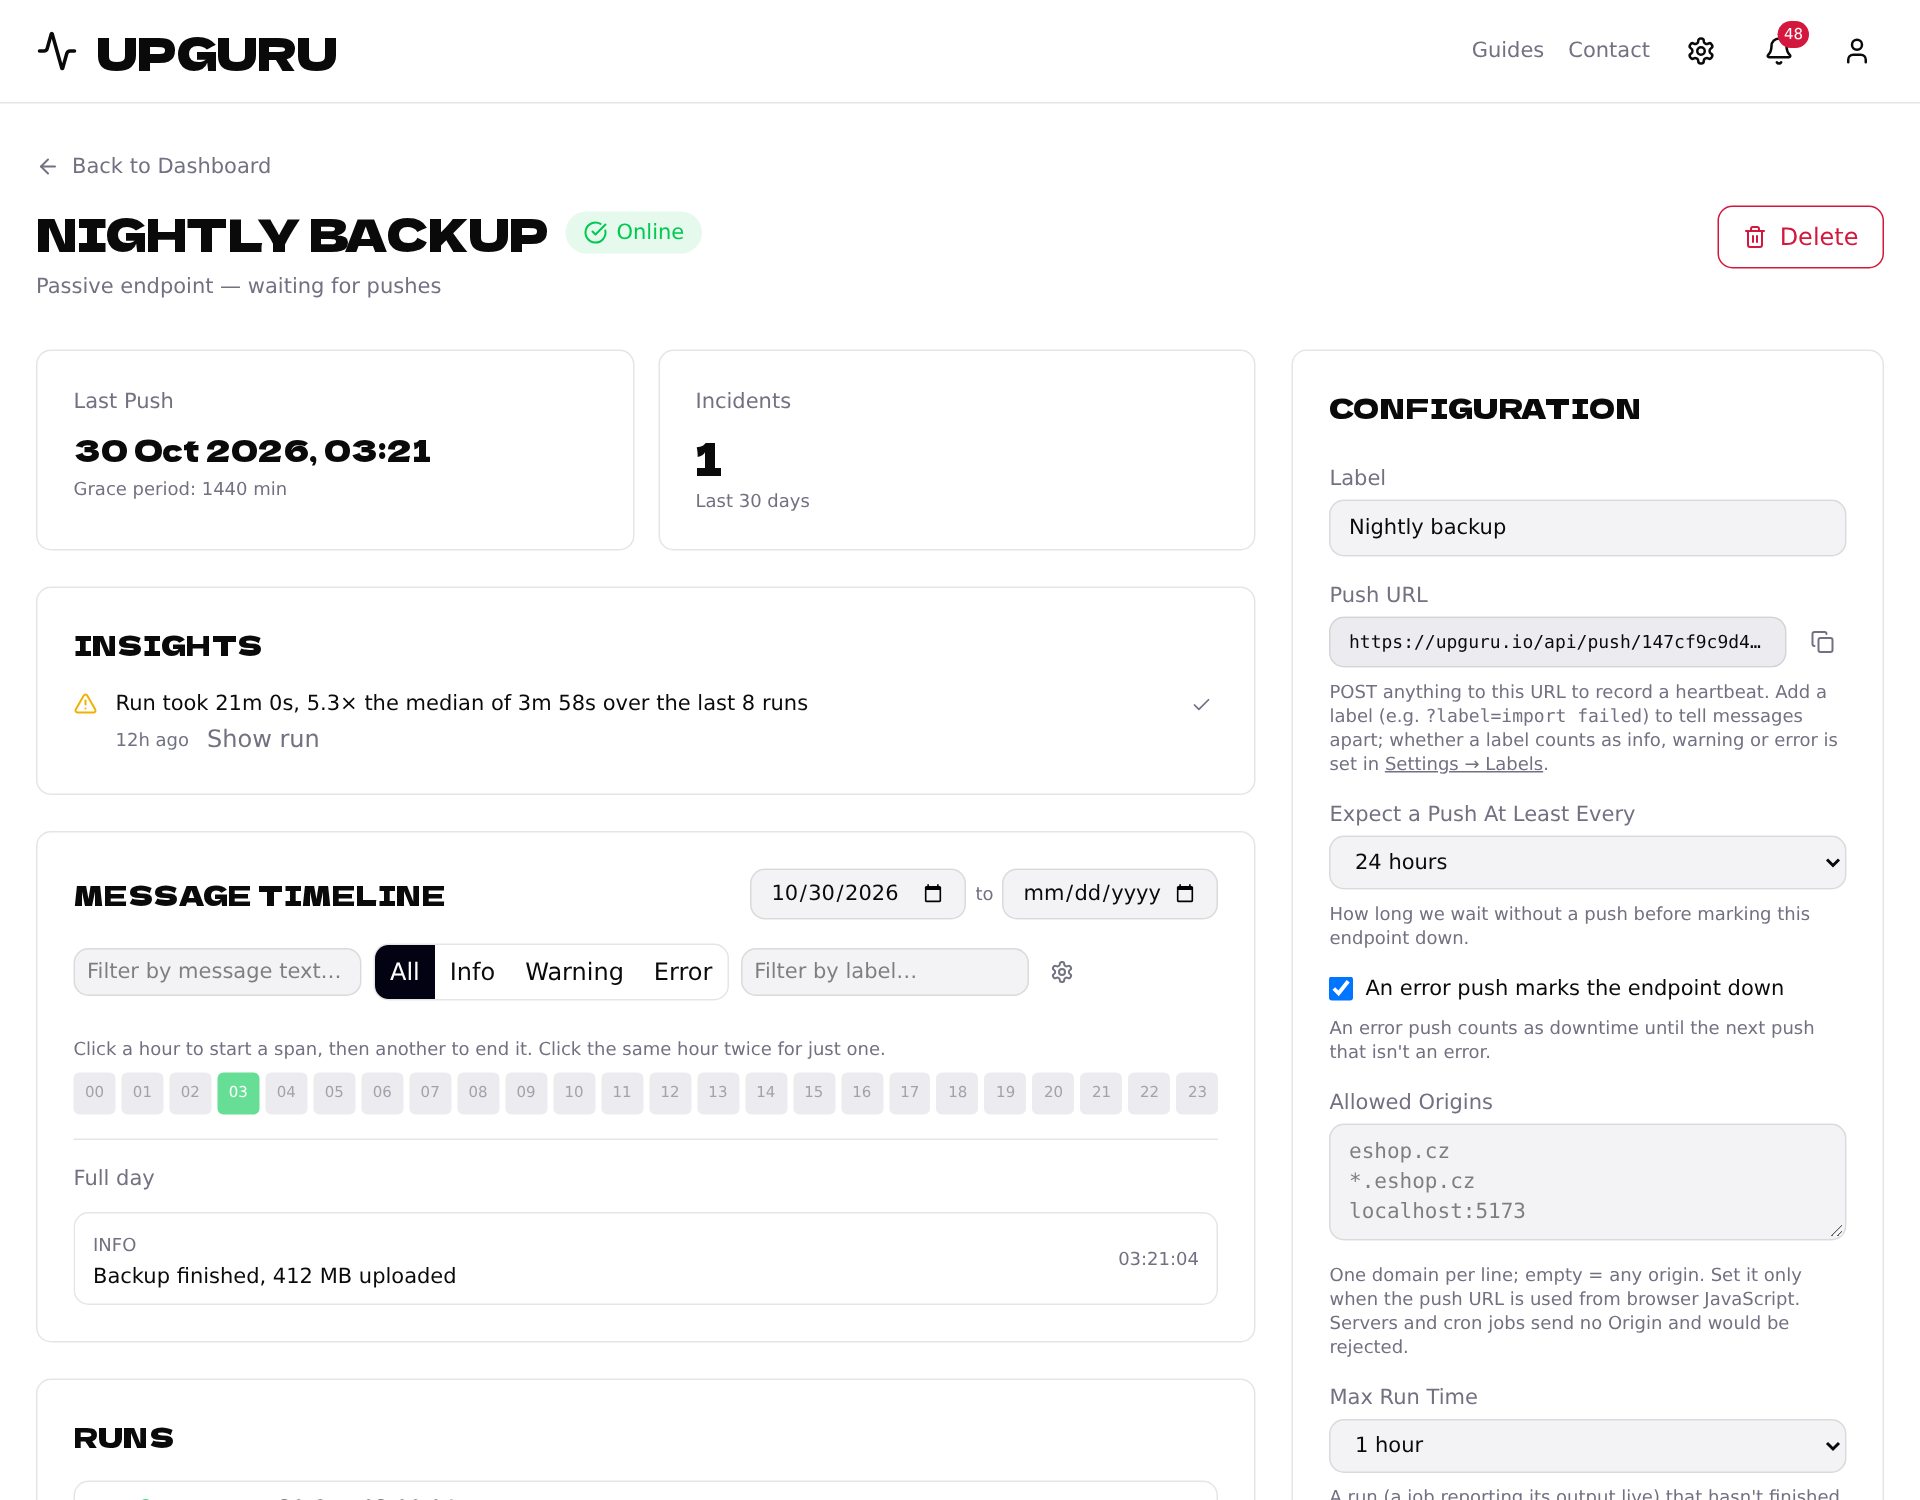
Monitor a cron job
Find out when a scheduled job fails — or silently stops running.
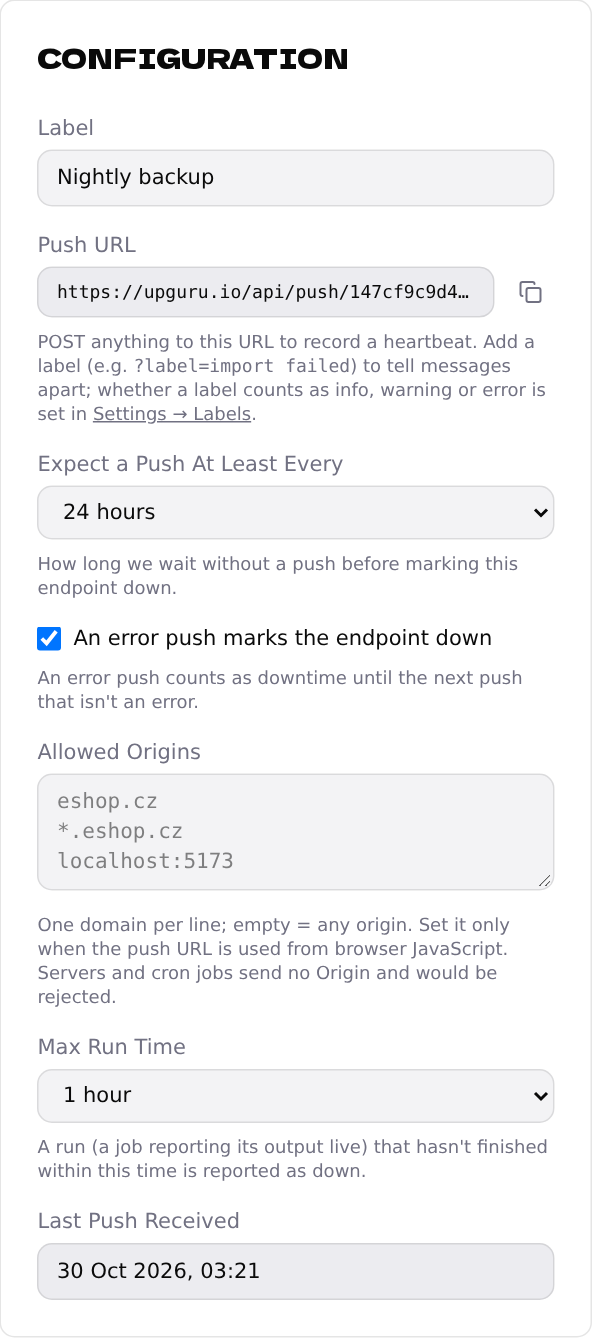
Catch a job that stopped running
Get an alert when a job doesn't report in — because it crashed, was removed or its server is off.
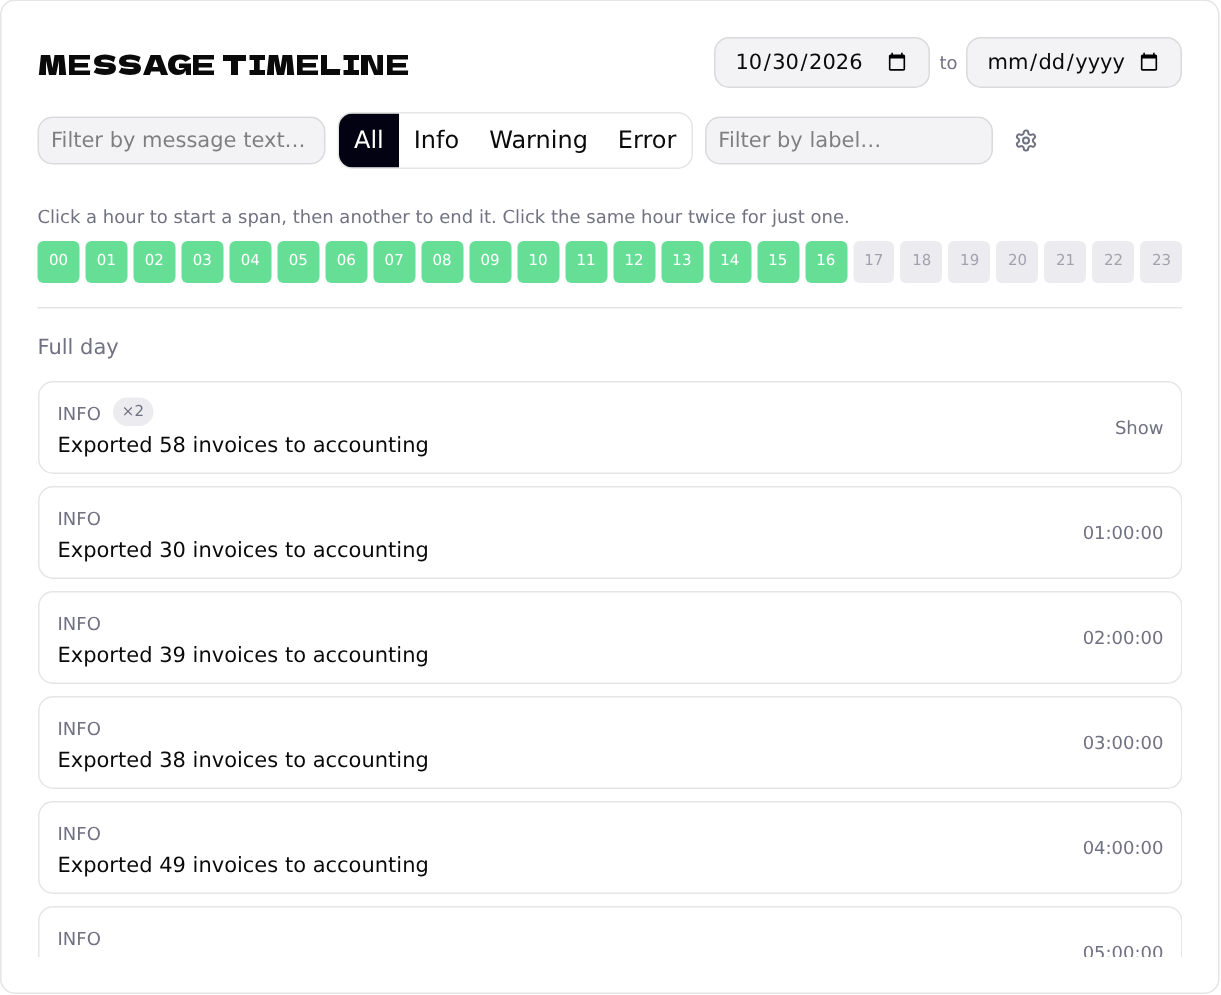
Send your job's output and errors
Store what your job printed, so you can see what happened without logging into the server.
Catch a job that hangs
Get alerted when a job starts but never finishes.
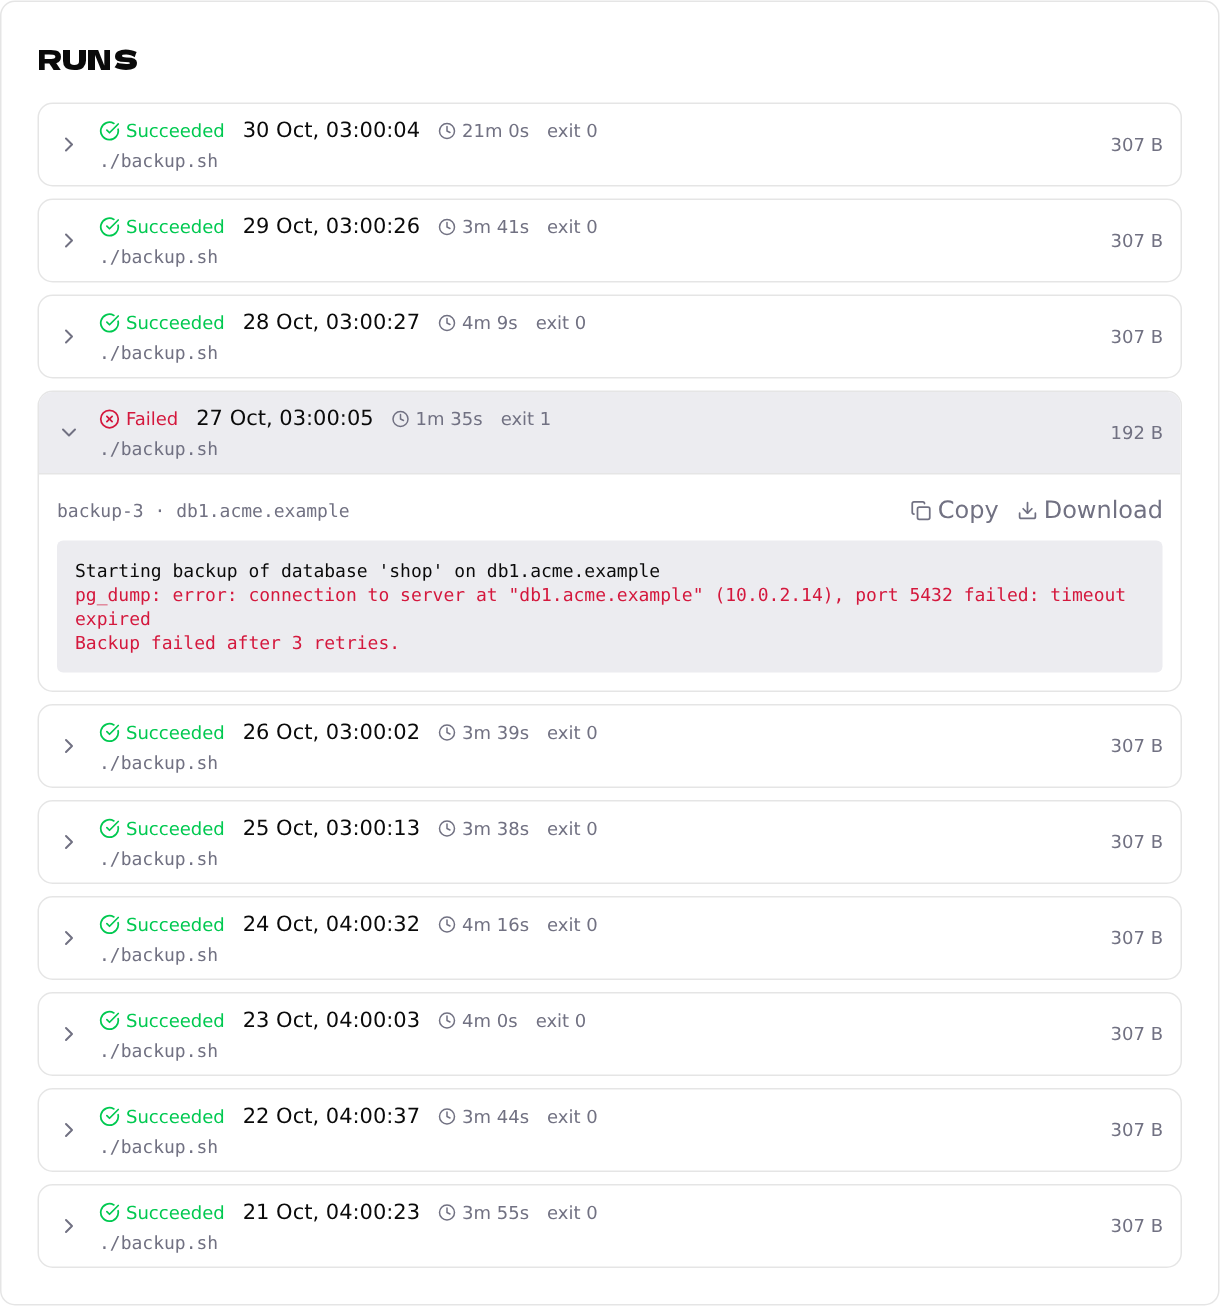
Watch job output live
See a job's output while it runs, with its duration, exit code and full log.
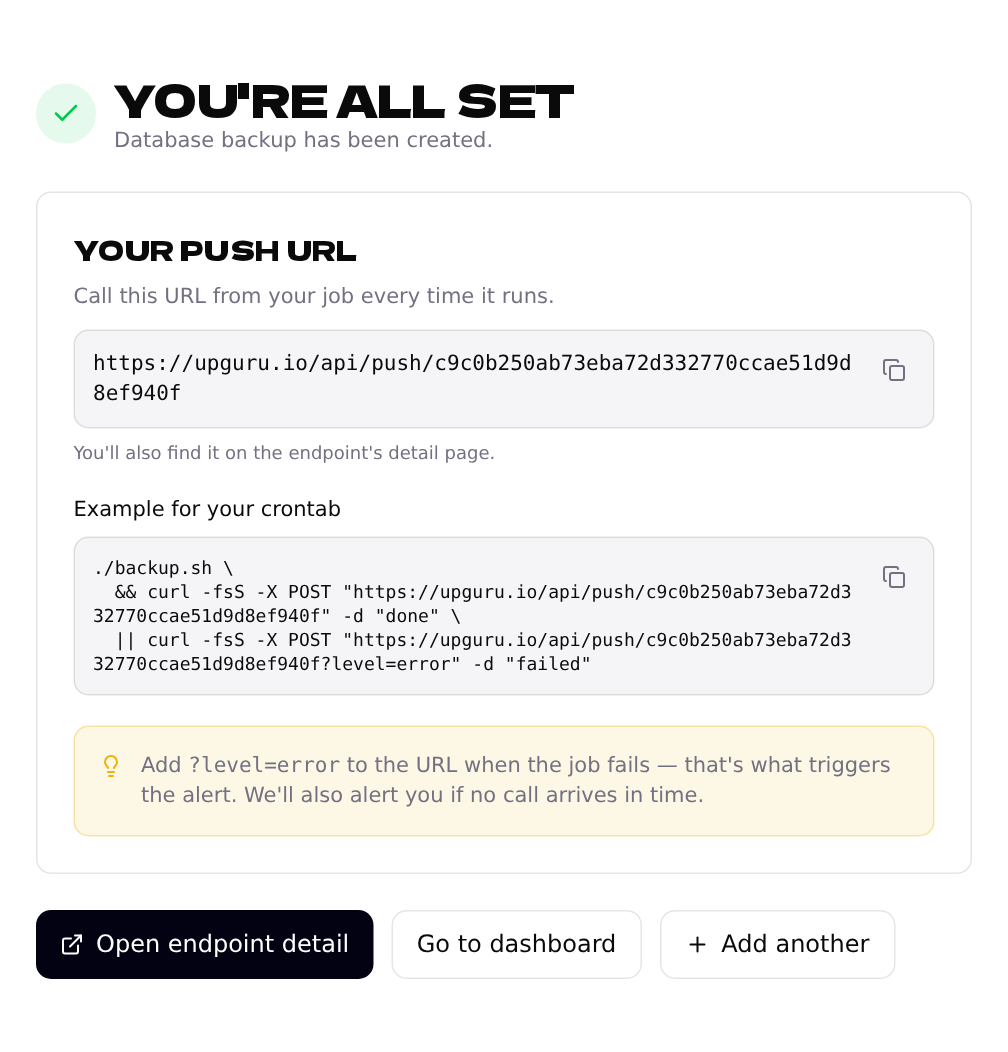
Recipe: Linux crontab
Monitor a job scheduled with cron on a Linux server.
Recipe: systemd timer
Monitor a job scheduled with a systemd timer.
Recipe: GitHub Actions
Monitor a scheduled GitHub Actions workflow.
Recipe: Kubernetes CronJob
Monitor a Kubernetes CronJob.
ERRORS AND EVENTS
Collect anything your app sends and get told about new errors.
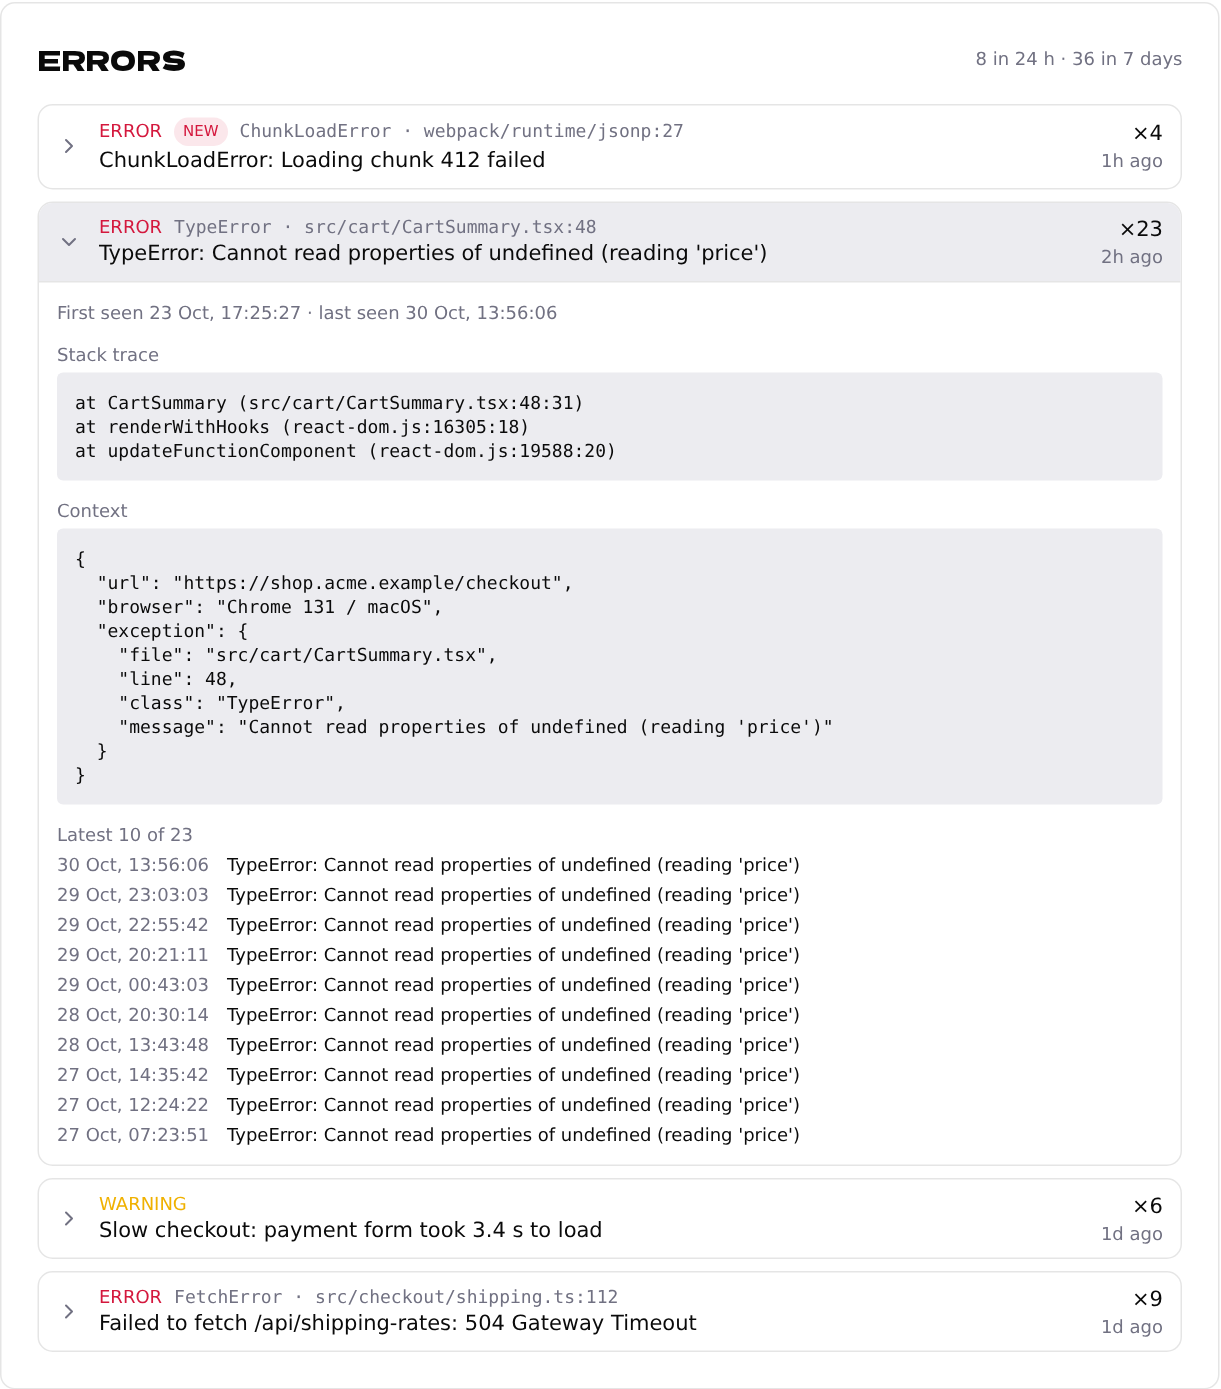
Collect errors and events from your app
Send errors, logs or any events from your app and get an email about new errors.
Report JavaScript errors from the browser
Find out about errors your visitors run into, with the stack trace.
Send events from Node.js
Report errors and events from a Node.js app or script.
Send events from Python
Report errors and log messages from a Python app or script.
Send errors from PHP and Laravel
Report exceptions and events from PHP, with a Laravel example.
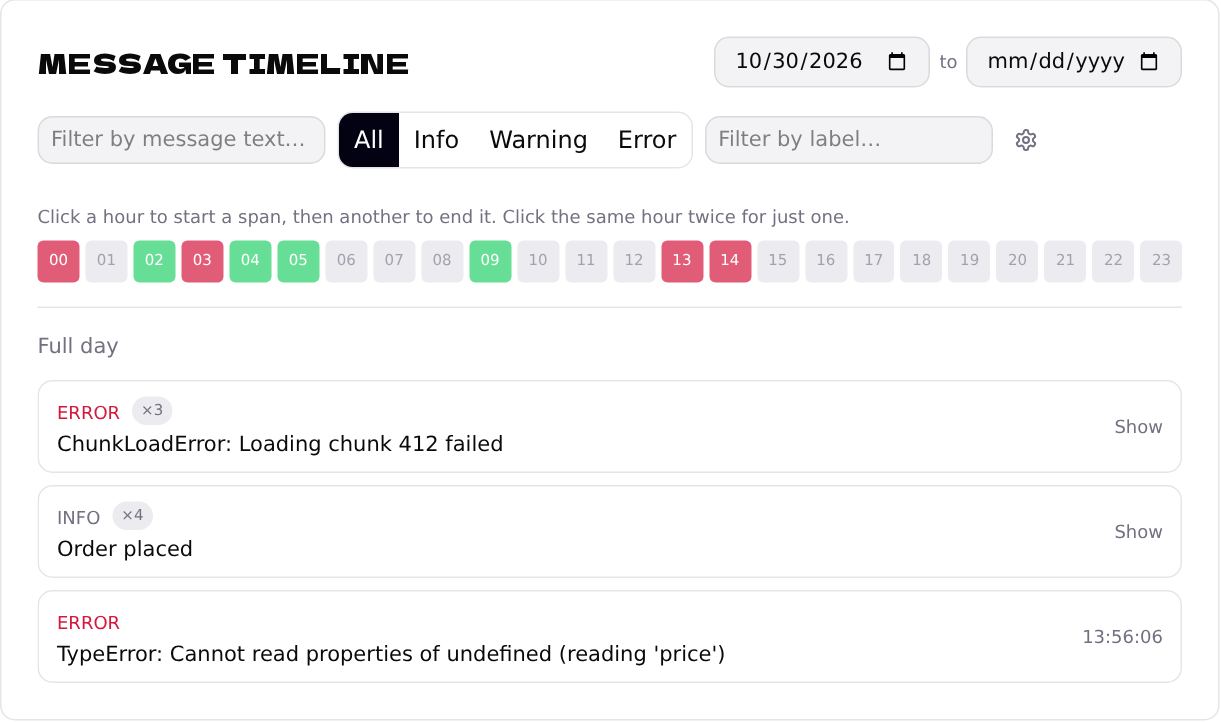
Reading the message timeline and insights
Find a message from any day, filter what you see and act on insights.
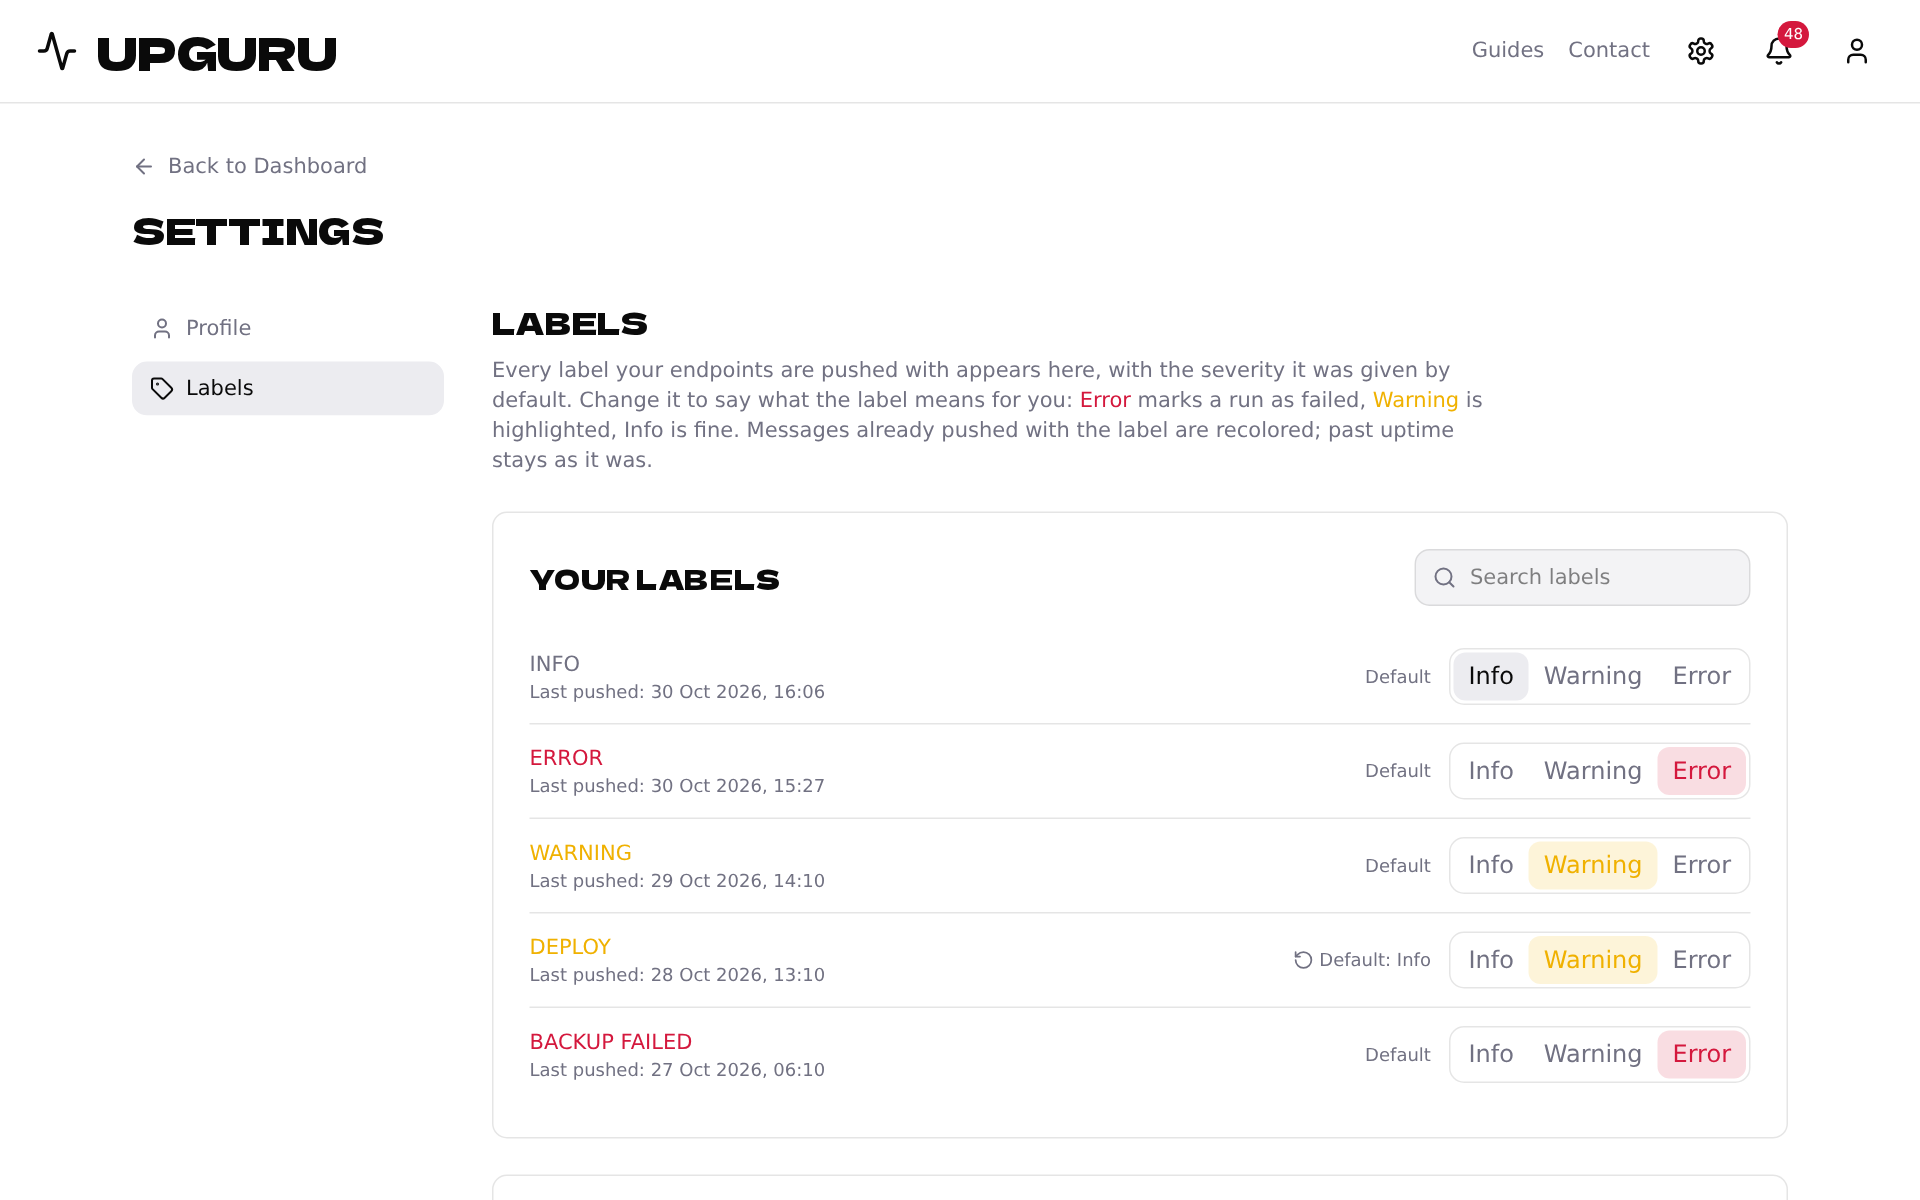
Labels: decide what counts as an error
Tell UPGURU which of your messages are errors, warnings or just information.
ALERTS AND SHARING
Get notified where you work and show your status to customers.
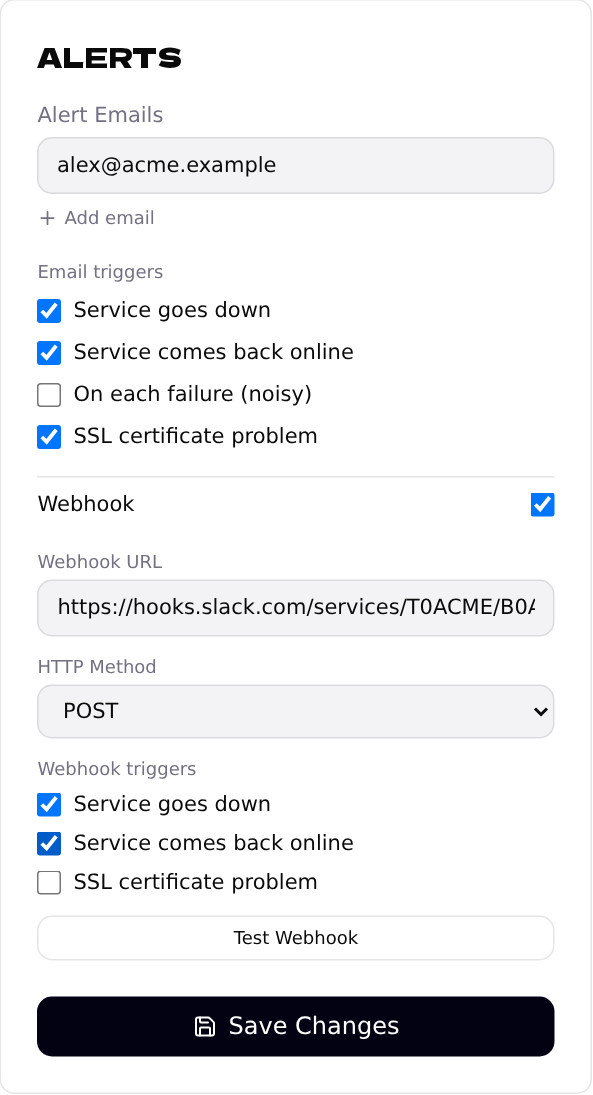
Alerts: email and webhooks
Decide who gets notified and send alerts to Slack or your own system.
Send alerts to Slack
Post a message to a Slack channel when something goes down or comes back.
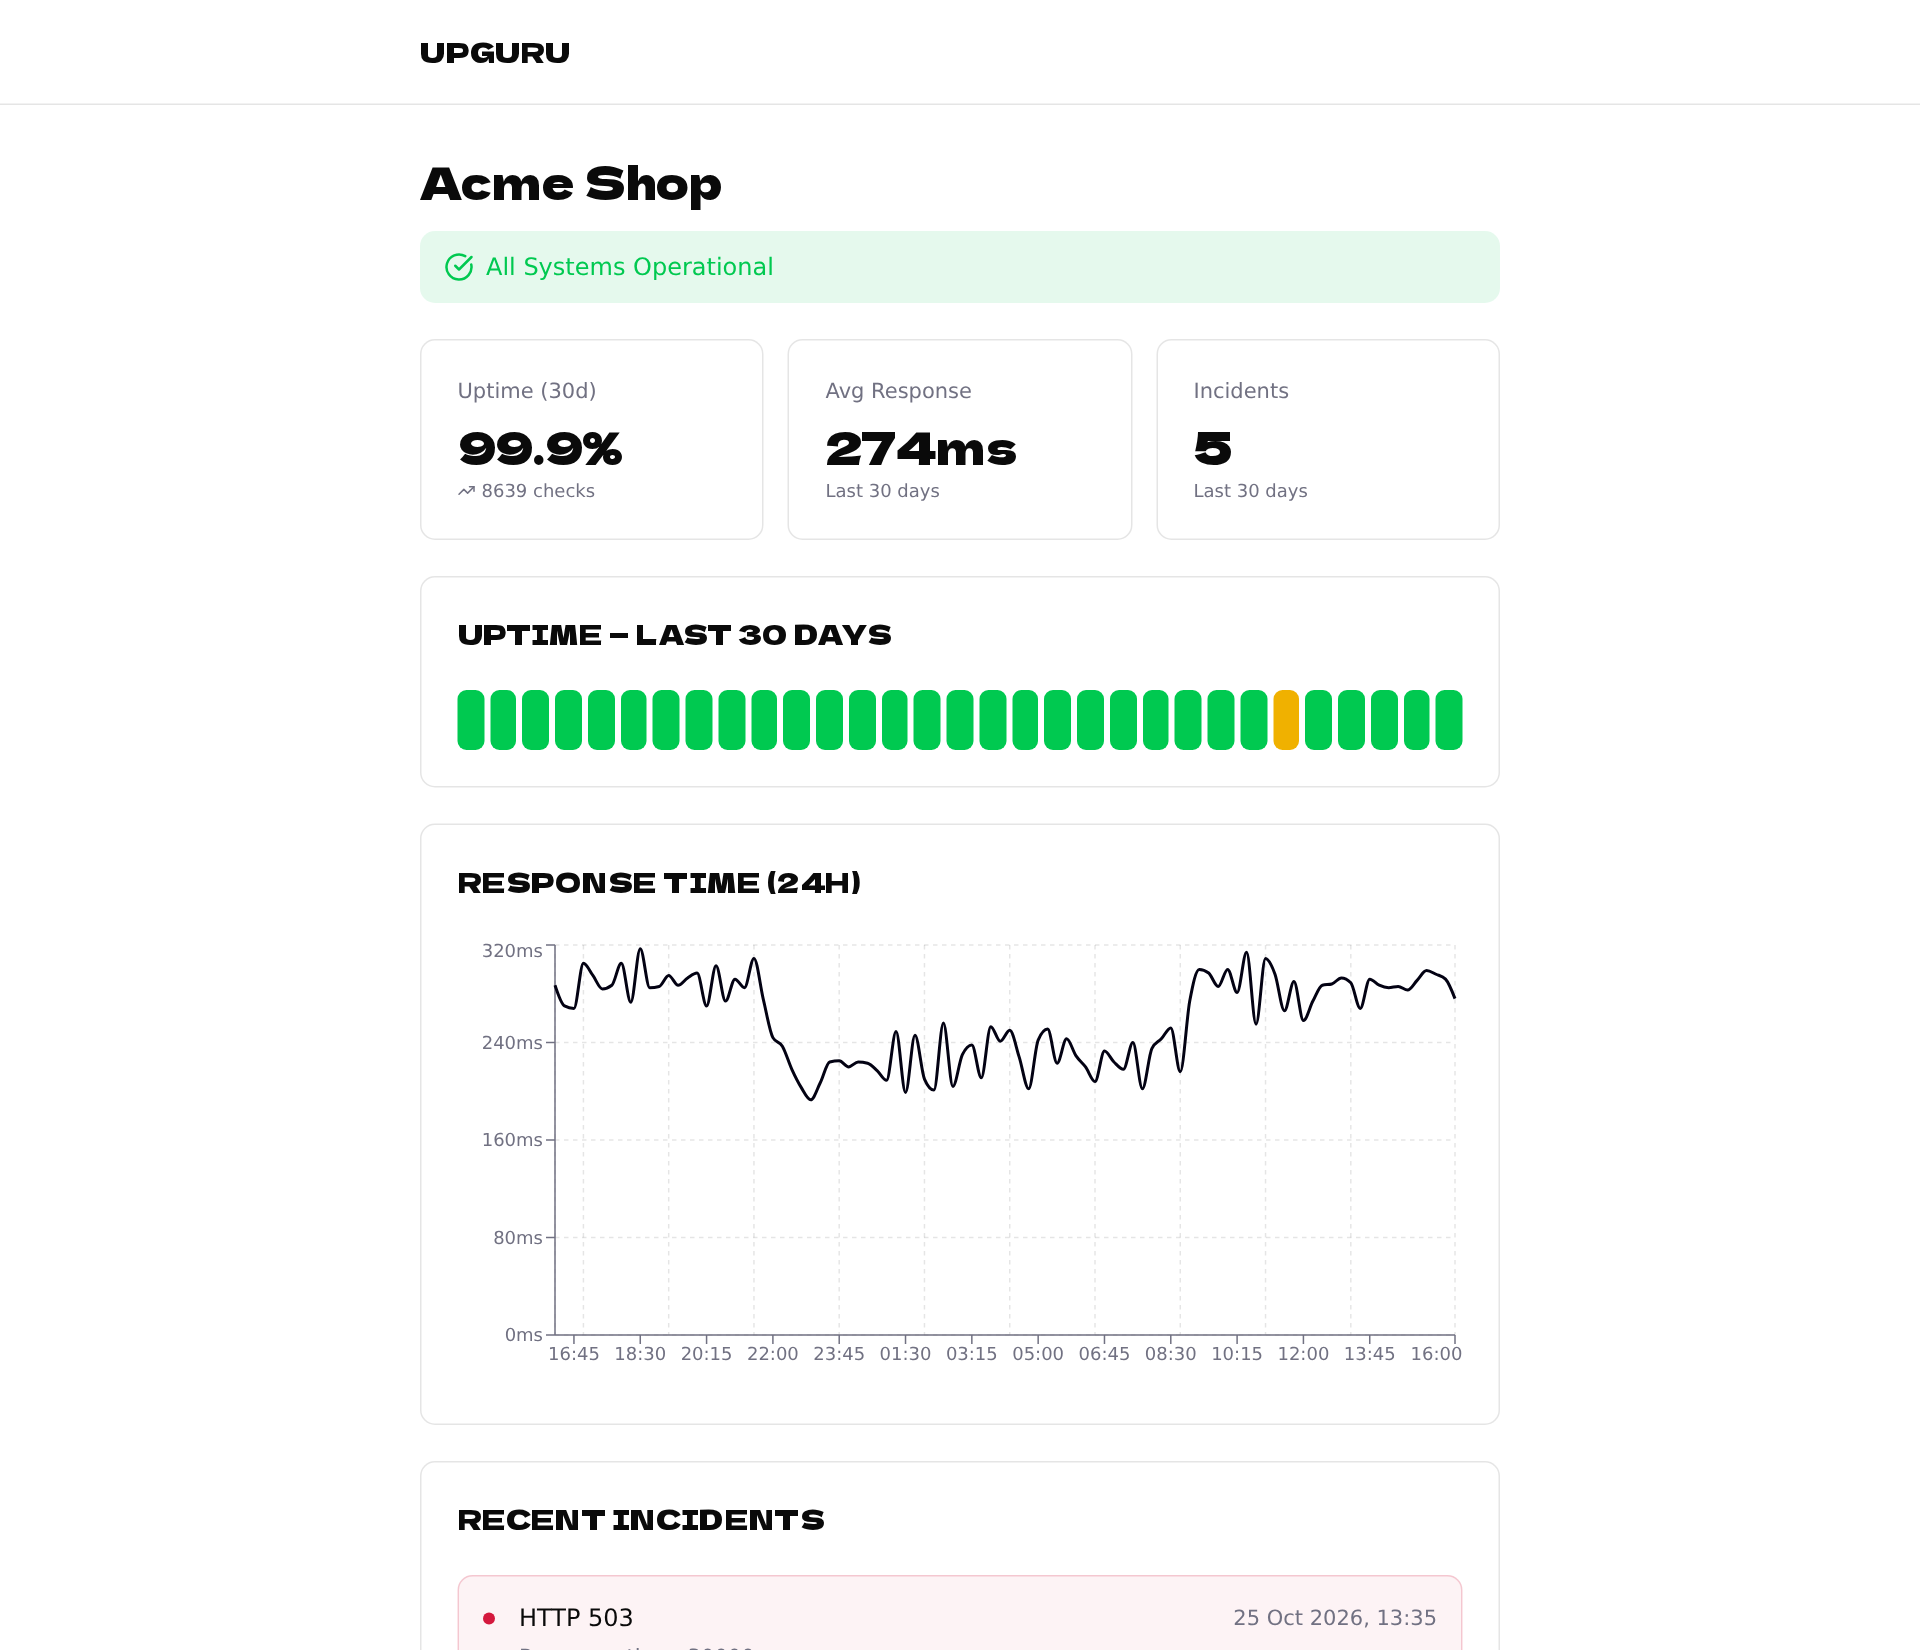
Share a public status page
Give your customers a page that shows whether your service is up.
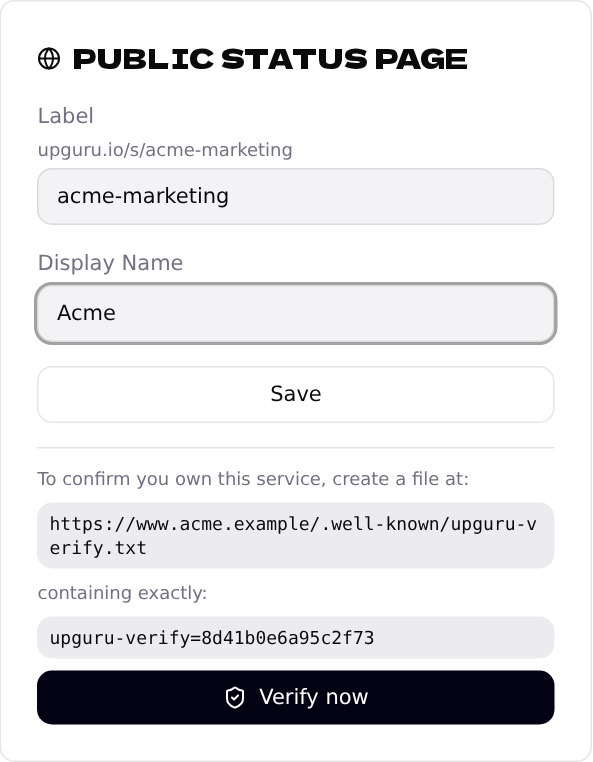
Status page verification: troubleshooting
What to do when “Verify now” doesn't work.