Once you monitor more than a handful of things, the tools above the endpoint cards help you find the one you need.
1
Search by name or address
Type into Search by name or URL…. Website checks are found by their name or address, push endpoints by their name.
2
Filter by type and status
- •The All types menu narrows the list to HTTP checks (websites and APIs) or Push endpoints (cron jobs and apps).
- •The buttons below it show only endpoints that are Online, Down, Waiting or Collecting data. The number on each button tells you how many there are.
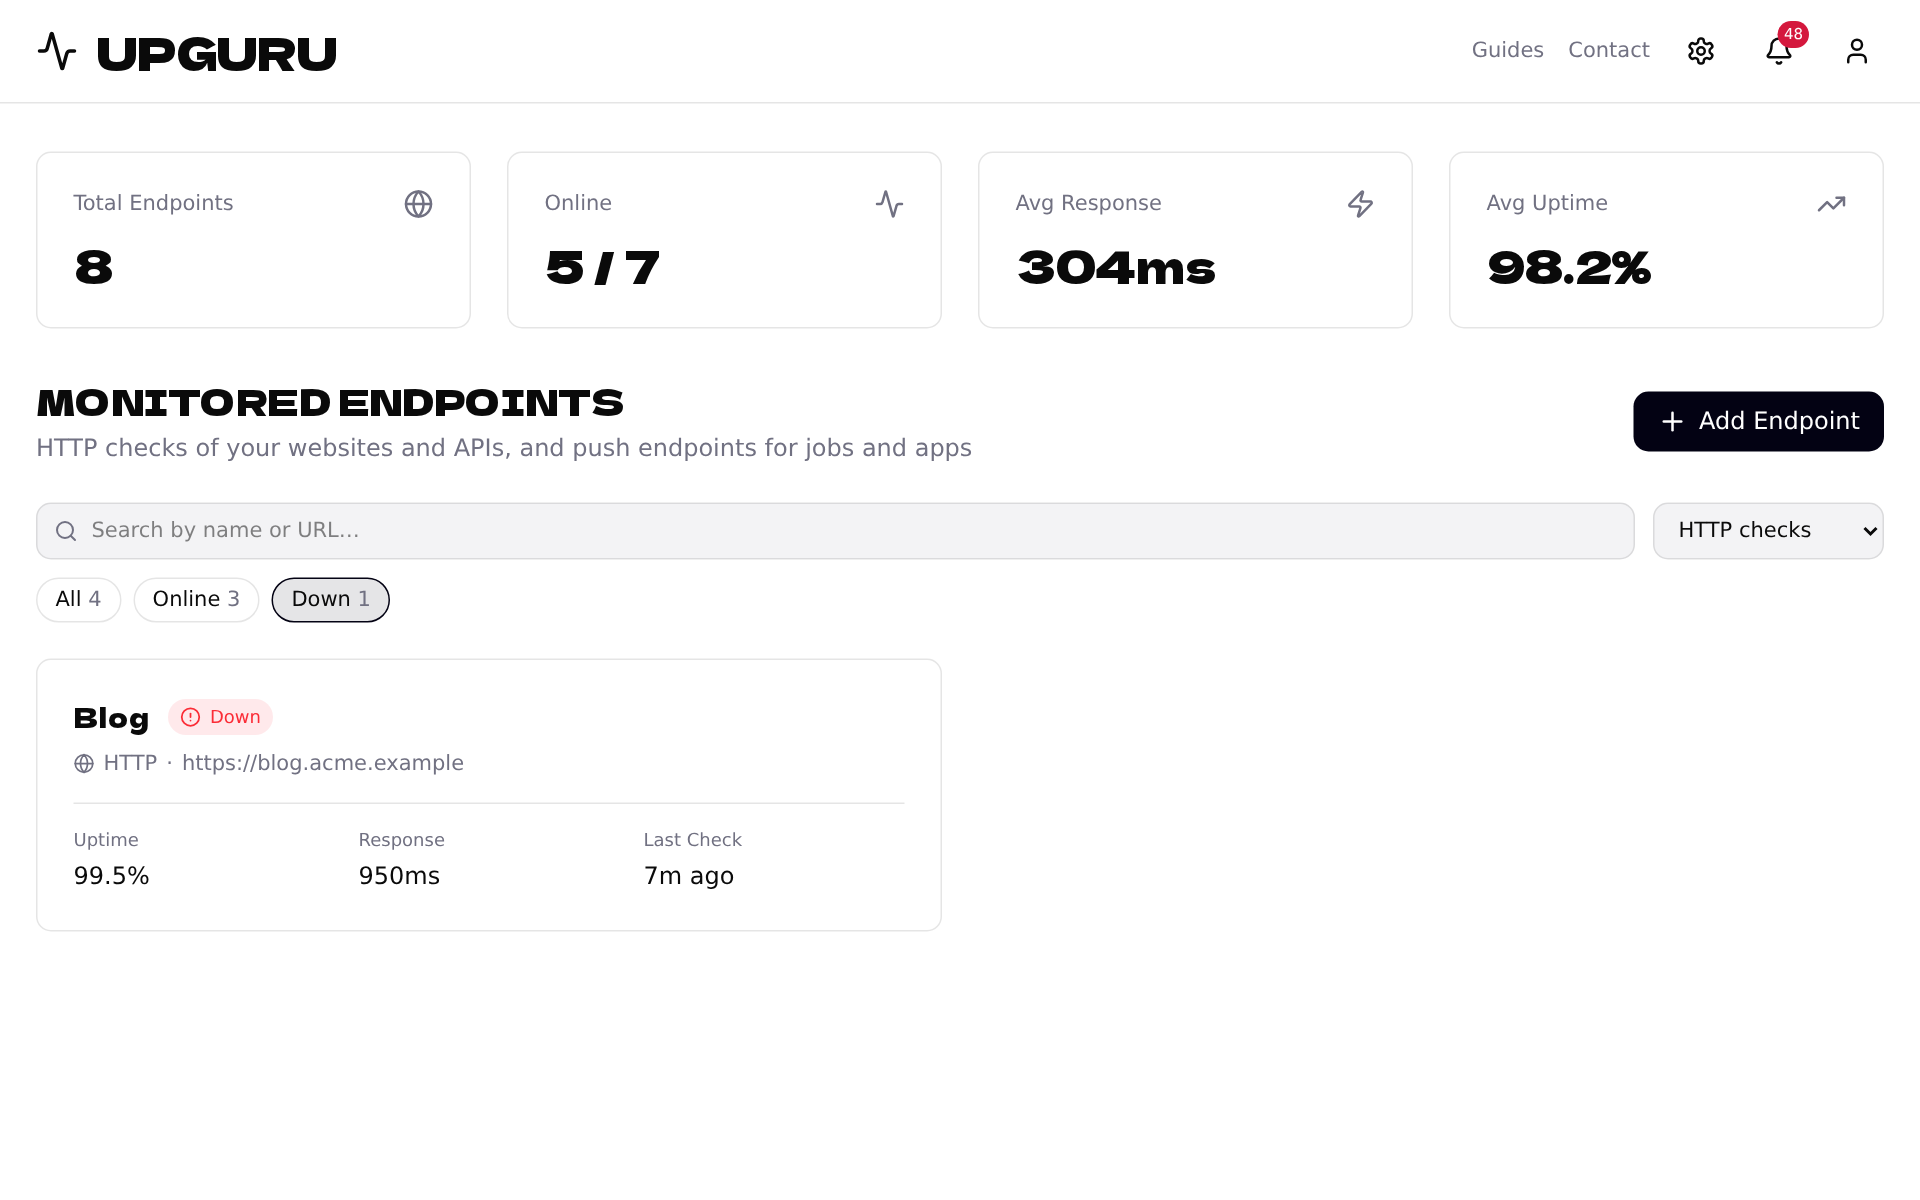
Click Down first thing in the morning: it's the quickest way to see what needs attention.
3
Page through the list
The dashboard shows 8 endpoints per page. Use the page numbers below the cards to see the rest. If nothing matches your filters, click Clear filters.
The dashboard refreshes itself every minute, so you can leave it open on a screen.