1
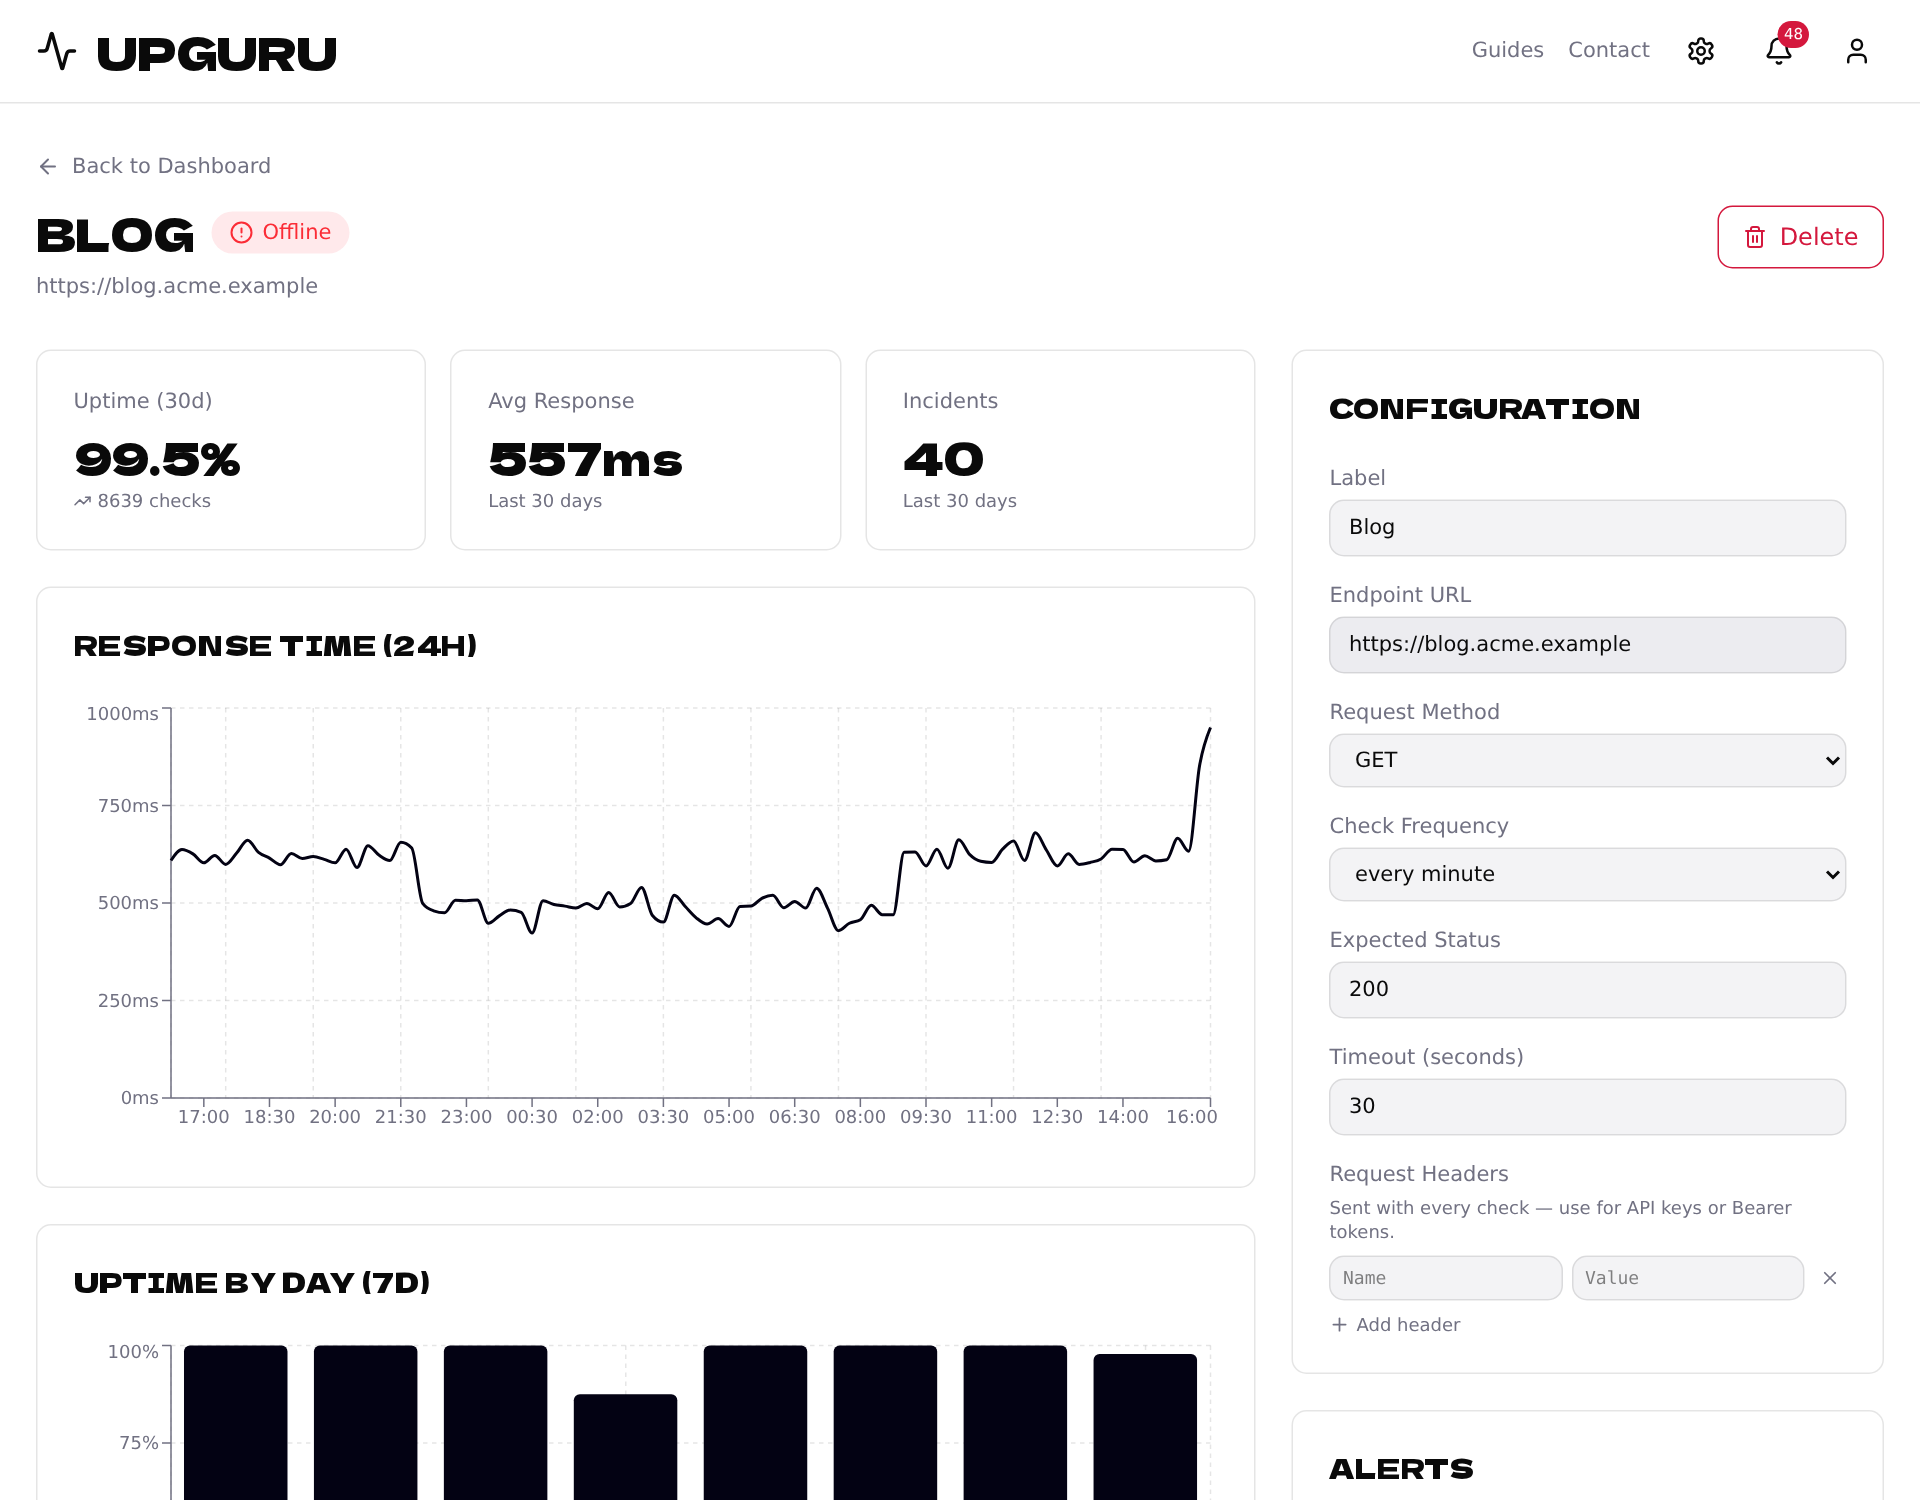
Look at the incident
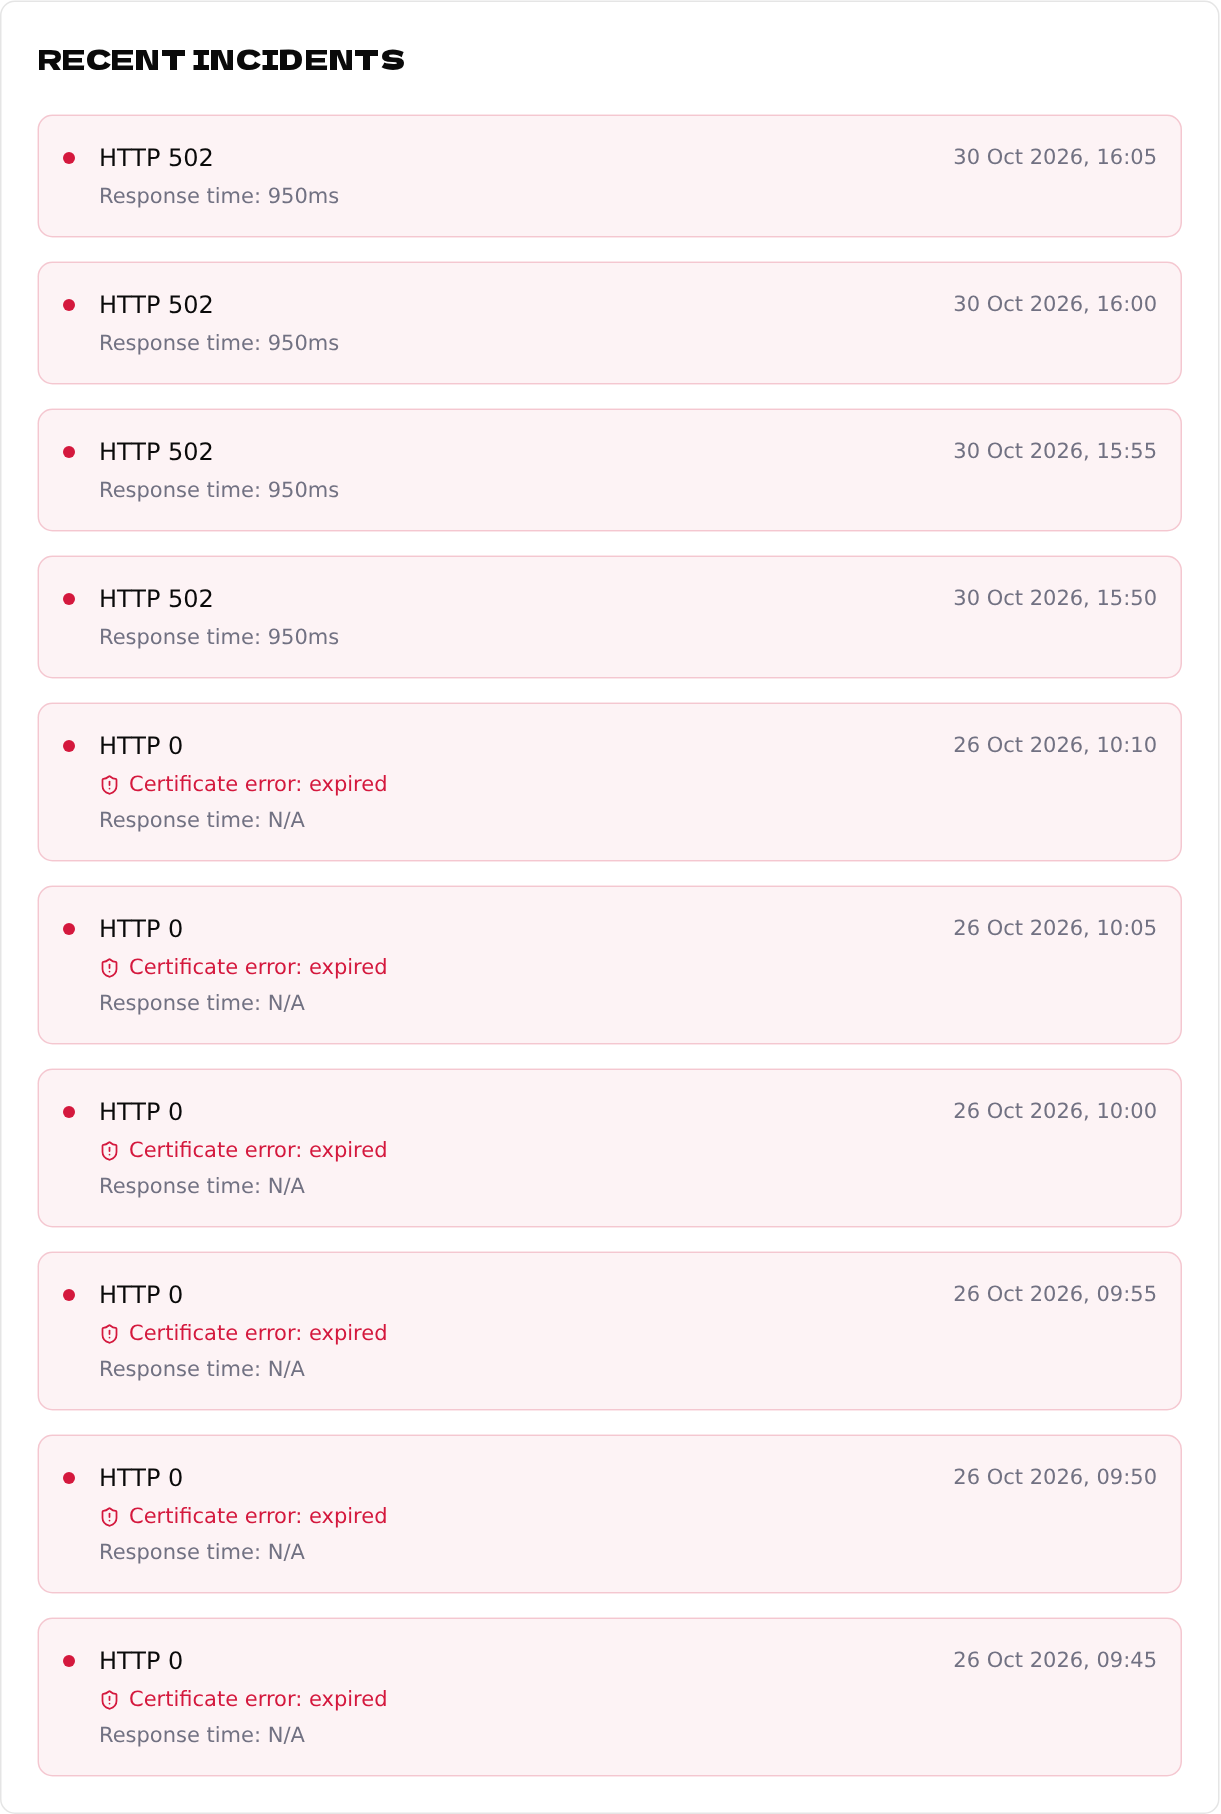
Open the endpoint and scroll to Recent incidents. Each one tells you what we got back. That is the best clue.
2
Find your case
- •HTTP timeout (or code 0) — we couldn't get an answer at all: the server is off, the domain doesn't resolve, a firewall blocks us, or the site took longer than the timeout (30 seconds by default).
- •HTTP 500–599 — your server answered with an error. Check its logs; a 502 or 504 usually means the app behind the web server isn't running.
- •HTTP 401 or 403 — the address needs a login or blocks bots. Add the key under request headers, or check whether a firewall or bot protection blocks our checks.
- •HTTP 404 — the address is wrong or the page was removed.
- •HTTP 429 — the site limits how often it can be called. Check less often: see choosing a check frequency.
- •Certificate error — the SSL certificate has expired or doesn't match the domain. See SSL certificate alerts.
3
Check it yourself
Run this from your computer to see what the address answers:
curl -sS -o /dev/null -w "%{http_code} in %{time_total}s\n" https://your-site.exampleWorks in your browser but fails here? Your browser may be logged in, or your firewall allows your own network only. We check from the outside, like a new visitor.
4
For cron jobs and apps
- •No heartbeat received within the configured grace period — the job didn't call its URL in time. Check that it still runs, and that it can reach the internet.
- •An error message — the job itself reported a failure. The message shows what it sent.