1
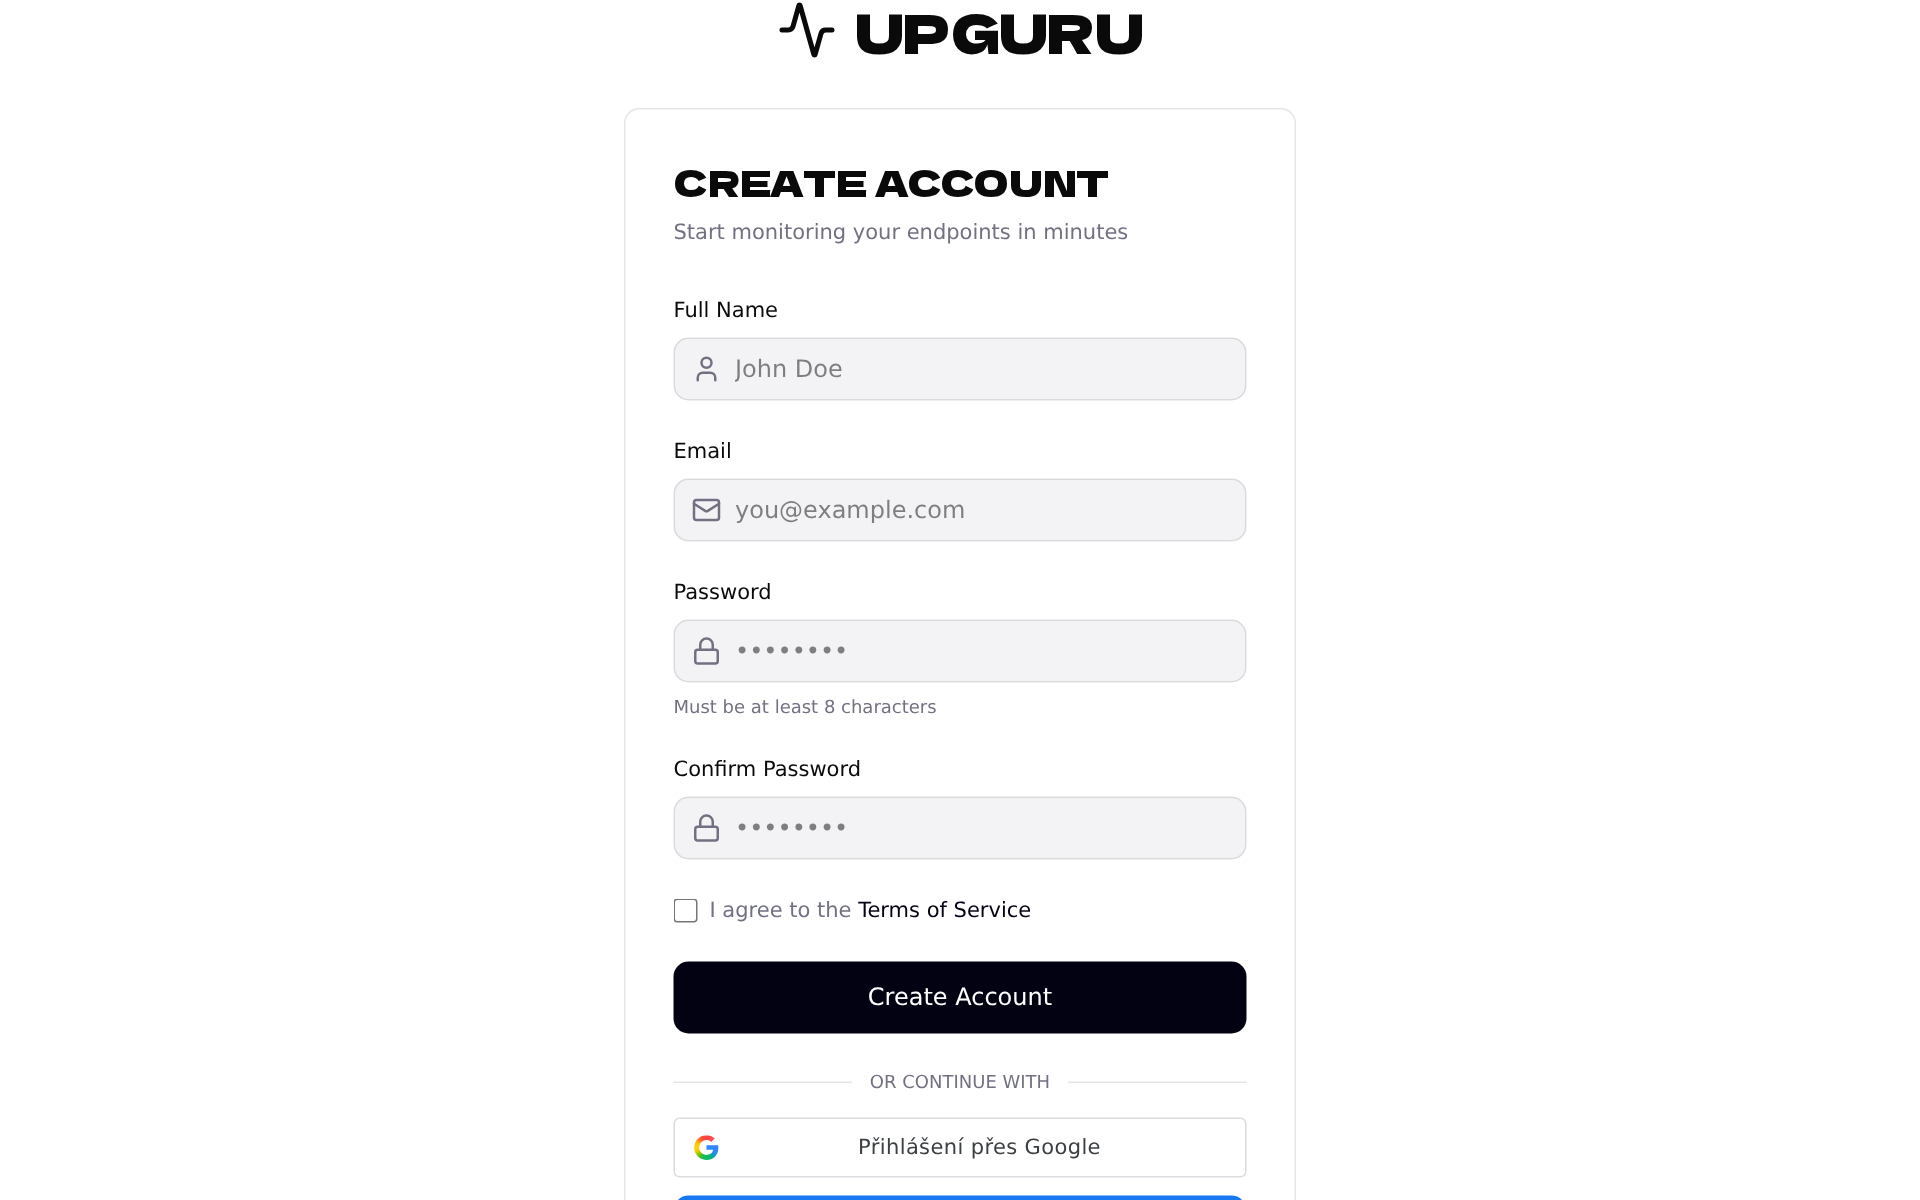
Create your account
Go to Sign up and enter your name, email and a password — or continue with Google or Facebook. It's free, and there's nothing to install.
2
Get to know the dashboard
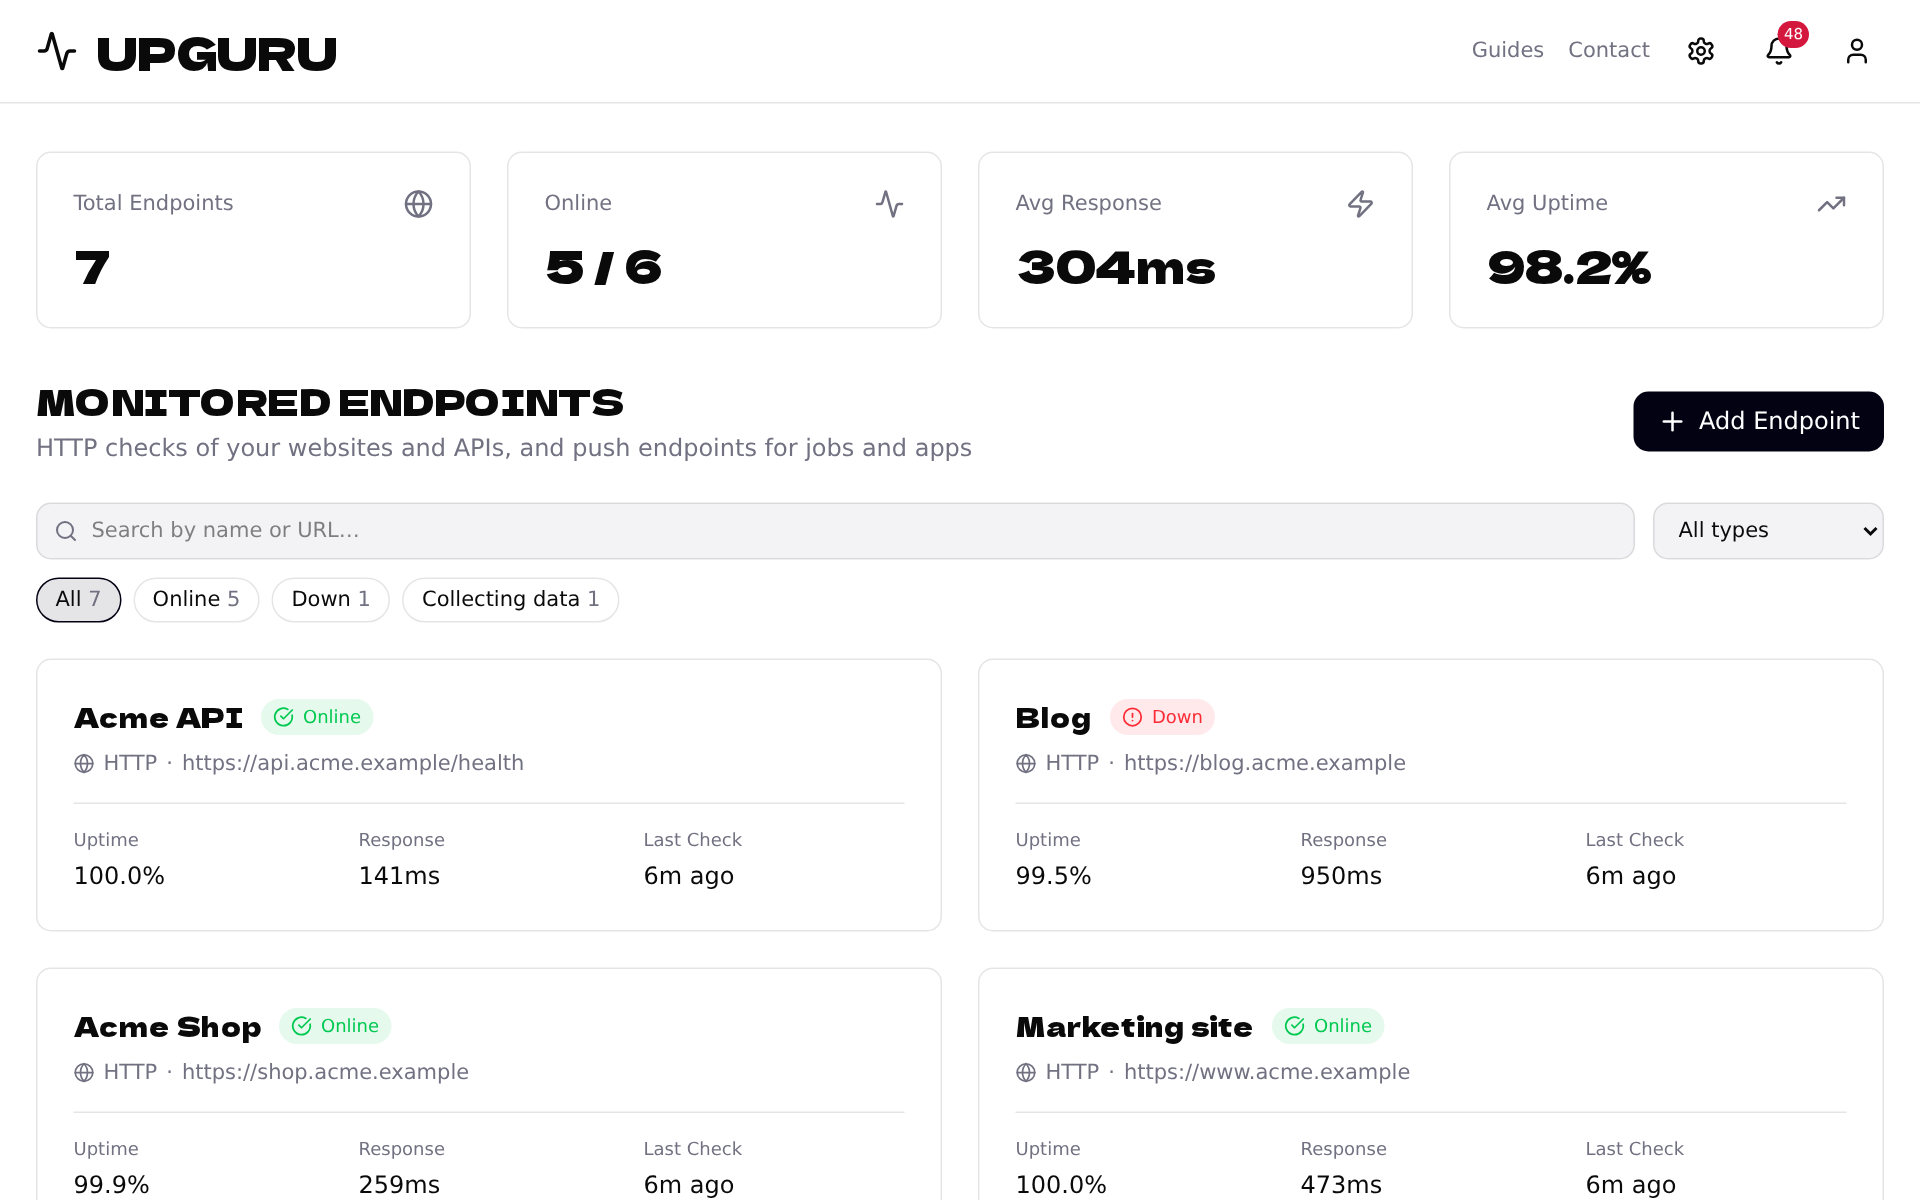
After signing in you land on the dashboard. It shows everything you monitor in one place:
- •The four tiles at the top sum it up: how many endpoints you have, how many are online, the average response time and the average uptime.
- •Below them, every endpoint has its own card. Click a card to see its details and history.
- •With more endpoints, use the search box and the status filters to find the one you need.
3
Understand the status badges
- •Online — everything works.
- •Down — something is wrong; we've already emailed you.
- •Checking or Waiting for push — the endpoint is new and has no result yet.
- •Collecting data — an endpoint that only collects events and errors from your app. It can't go down.
The bell icon in the top bar shows how many problems happened in the last 7 days. Click it to see them all at a glance.
4
Add your first endpoint
Click + Add Endpoint and pick what you want to watch. Start with a website or API — it takes about a minute.