An Events & logs endpoint is a place your app can send anything to: JavaScript errors, log lines, deploys, sign-ups. We store it all, group repeated errors together and email you a summary when a new error appears. Everything else is simply recorded.
Create the endpoint
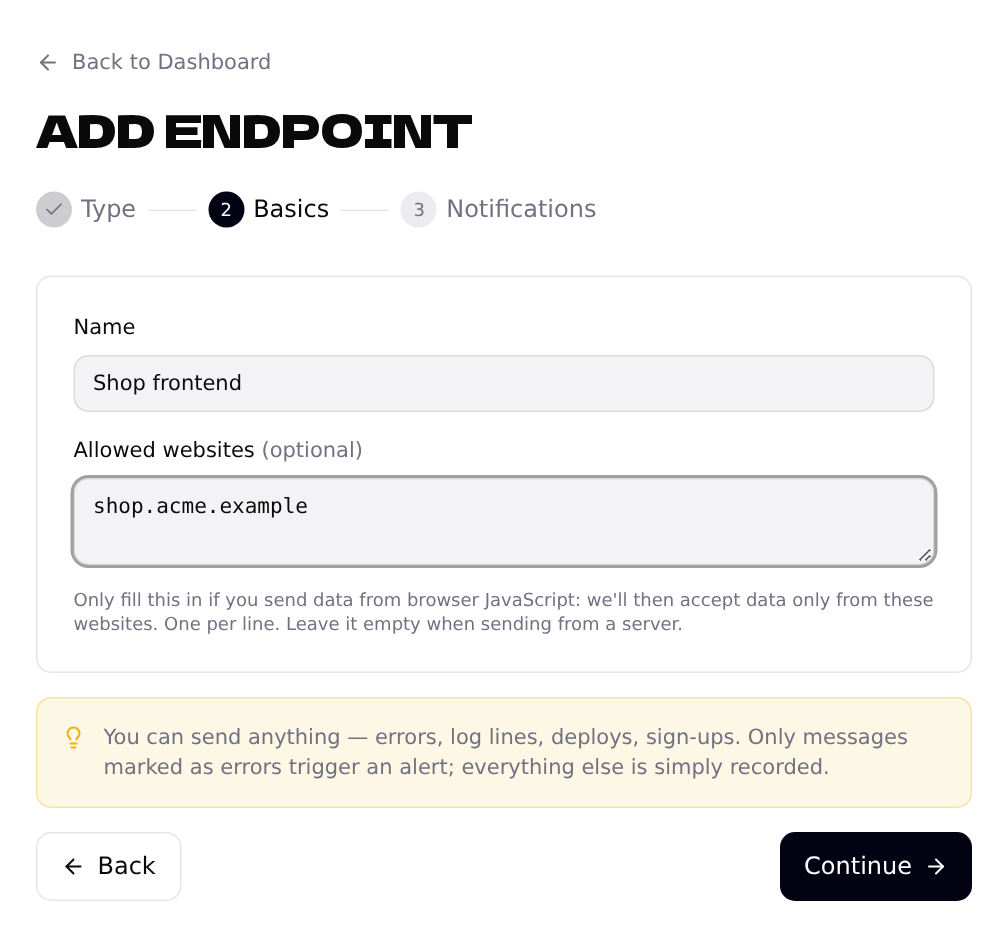
Click + Add Endpoint, pick Events & logs and give it a name.
Send your first event
Send plain text, or JSON with a level and a message. The level can be anything (info, deploy, payment failed, …); levels like error or failed count as errors.
curl -X POST "https://upguru.io/api/push/YOUR-TOKEN" \
  -H "Content-Type: application/json" \
  -d '{"level": "info", "message": "User signed up"}'
From the browser, report errors like this:
window.addEventListener("error", (e) => {
  fetch("https://upguru.io/api/push/YOUR-TOKEN", {
    method: "POST",
    body: JSON.stringify({
      level: "error",
      message: e.message,
      context: { exception: { class: e.error?.name, message: e.message,
                              file: e.filename, line: e.lineno, trace: e.error?.stack } },
    }),
  });
});context.exception (class, file, line, trace) and we show the stack trace with each error. Anything else in context — the page URL, the browser — is shown with it too.Browse everything on the timeline
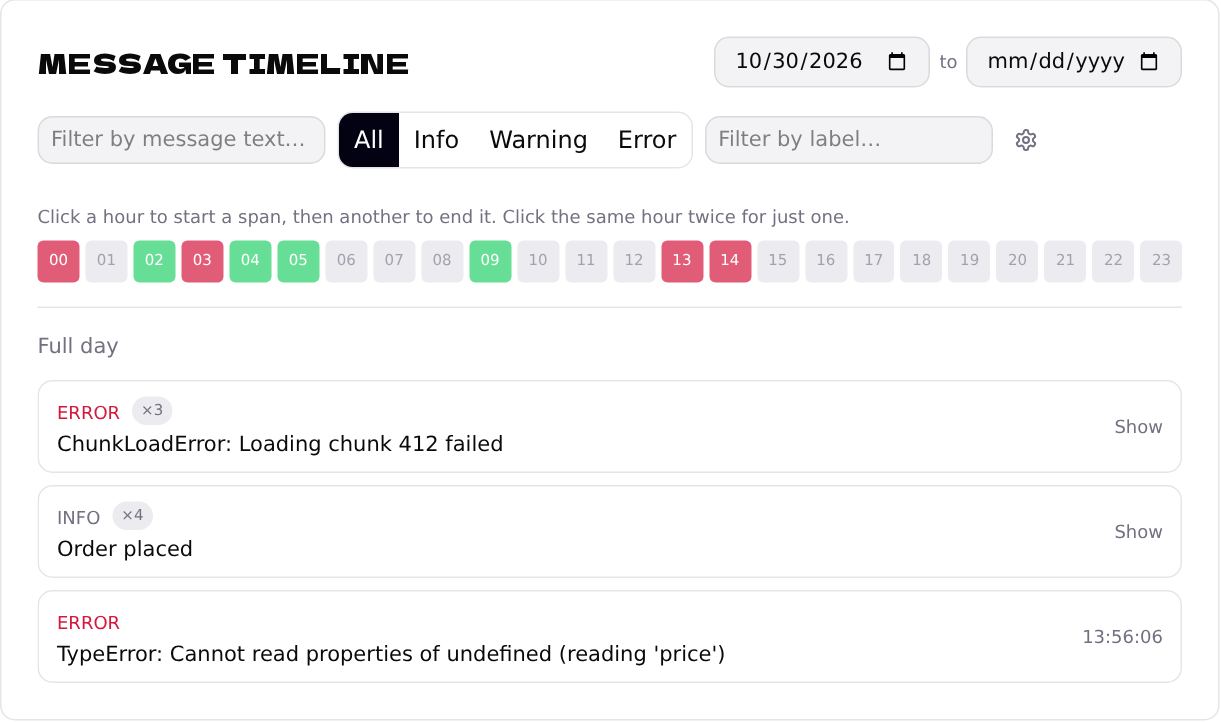
The Message timeline shows a day hour by hour: green hours had messages, yellow had warnings, red had errors. Click an hour to see what was sent, or filter by text or level.
Fix errors one group at a time
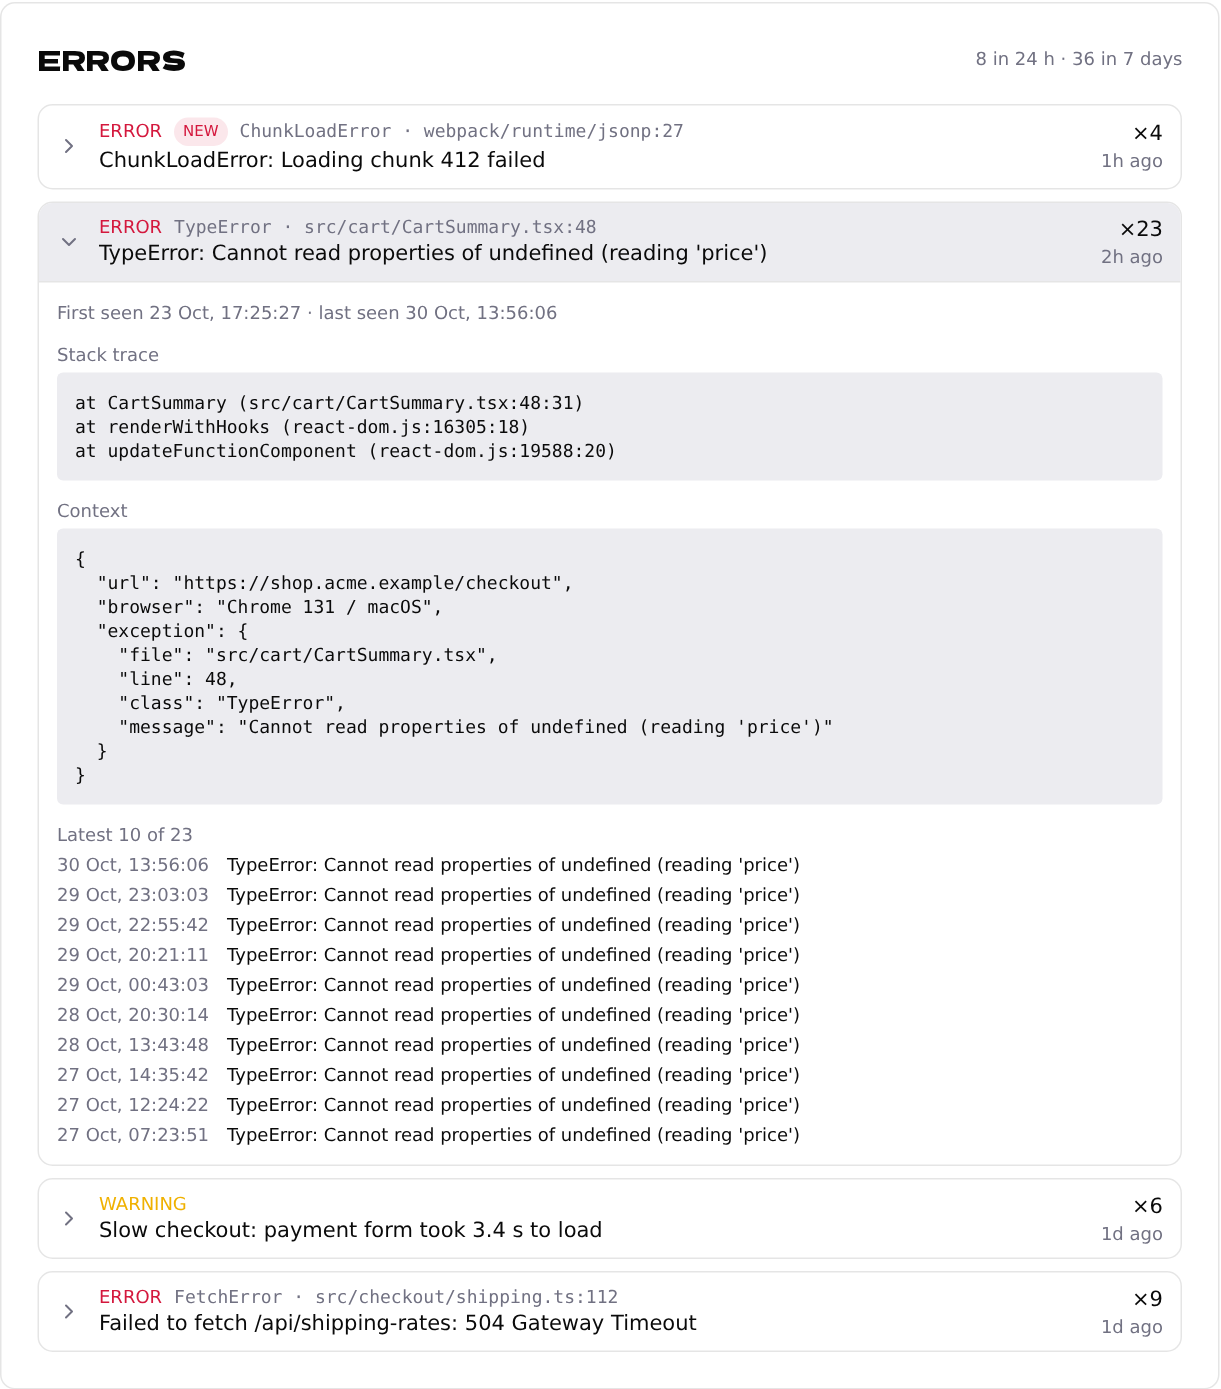
The same error sent 500 times is one row under Errors, with a count and when it was last seen. Errors that first appeared in the last 24 hours are marked NEW. Click a row for the full message, the stack trace and the context.
New errors also appear under Insights, so you notice them even on a busy day:
